In this article, let’s try to estimate the Prometheus storage required for an environment.
Prometheus stores data in a time-series format and over time the targets which send metrics to the Prometheus server will get increased hence the number of metrics Prometheus ingests & stores will increase too leading to disk space issues.
From the docs:
Prometheus stores an average of only 1-2 bytes per sample. Thus, to plan the capacity of a Prometheus server, you can use the rough formula :
needed_disk_space = retention_time_seconds * ingested_samples_per_second * bytes_per_sample
- By default, the metrics retention period is 15 days. In this case, let’s assume you want to keep the metrics for 1 Month.
To figure out the above formula, let’s check our Prometheus to understand the parameters which are mentioned above.
- How many samples are stored/ingested
This metric is exposed by the Prometheus server which represents a total number of appended samples i.e stored metric samples.
To get an average number of samples stored in Prometheus, you can run :
(rate(prometheus_tsdb_head_samples_appended_total[1d])
Which looks like this:
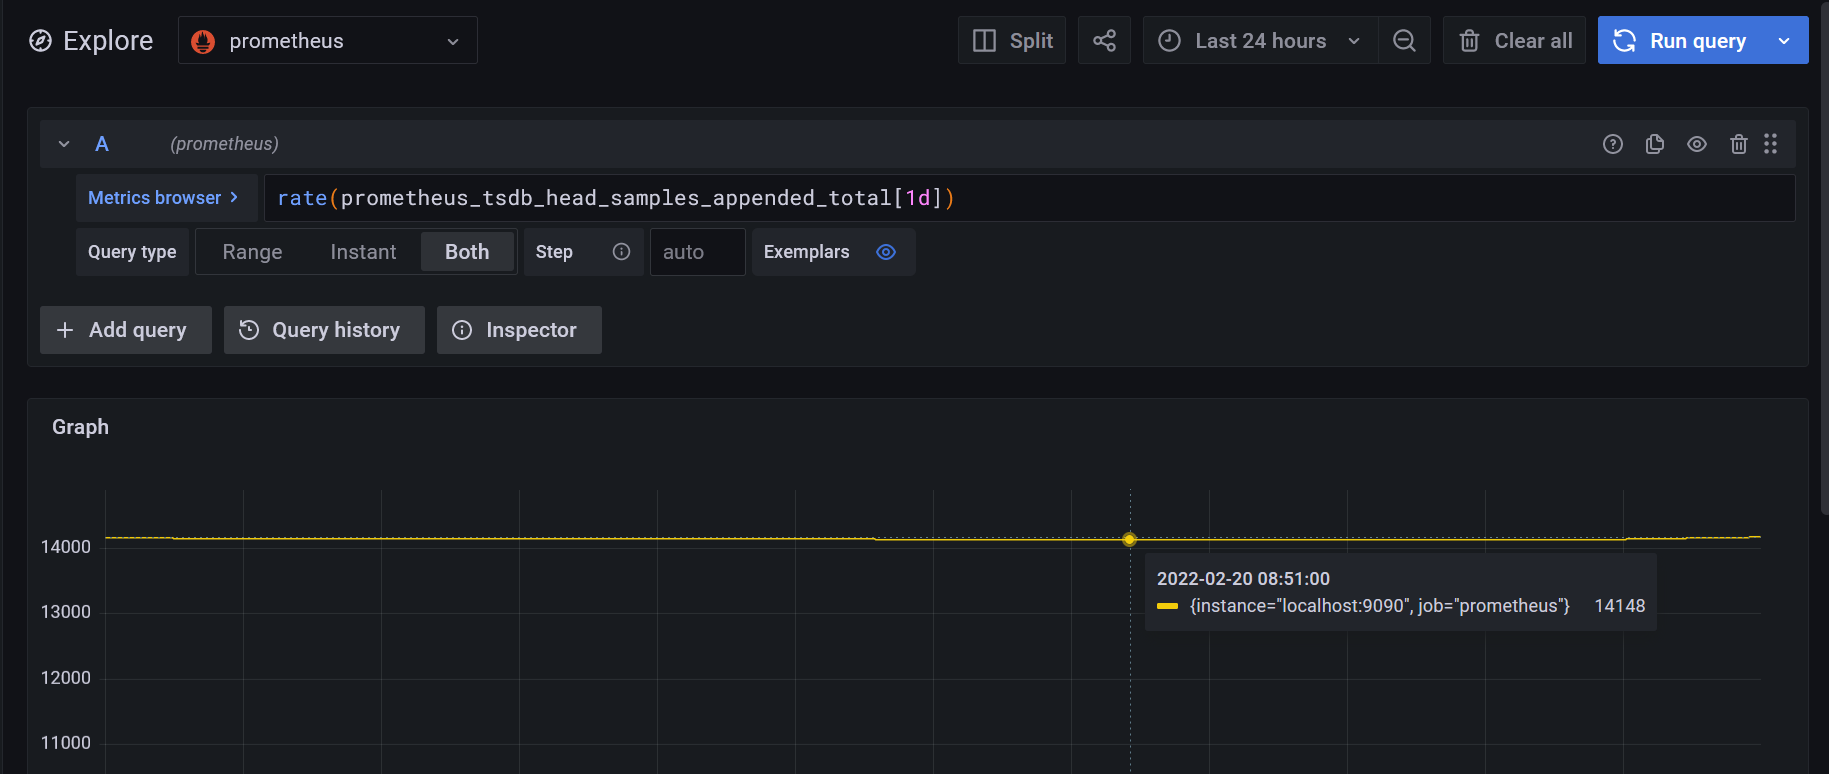
We can see that around 15k metrics are stored in the Prometheus.
- Calculating byte per sample :
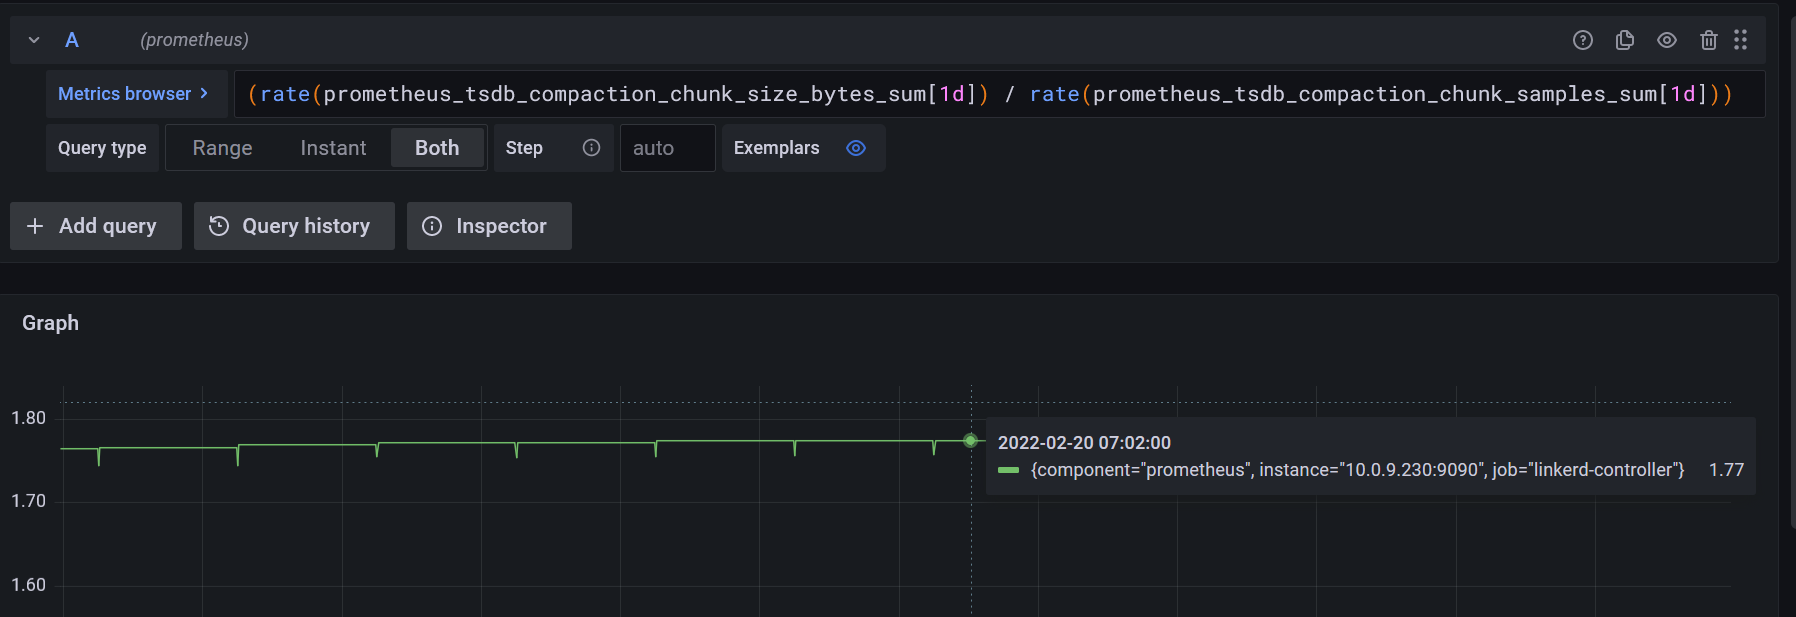
To calculate, what’s the average size of each sample ingested, we can run the below query :
(rate(prometheus_tsdb_compaction_chunk_size_bytes_sum[1d]) / rate(prometheus_tsdb_compaction_chunk_samples_sum[1d]))
Which is around 1.7 byte / sample in our case :
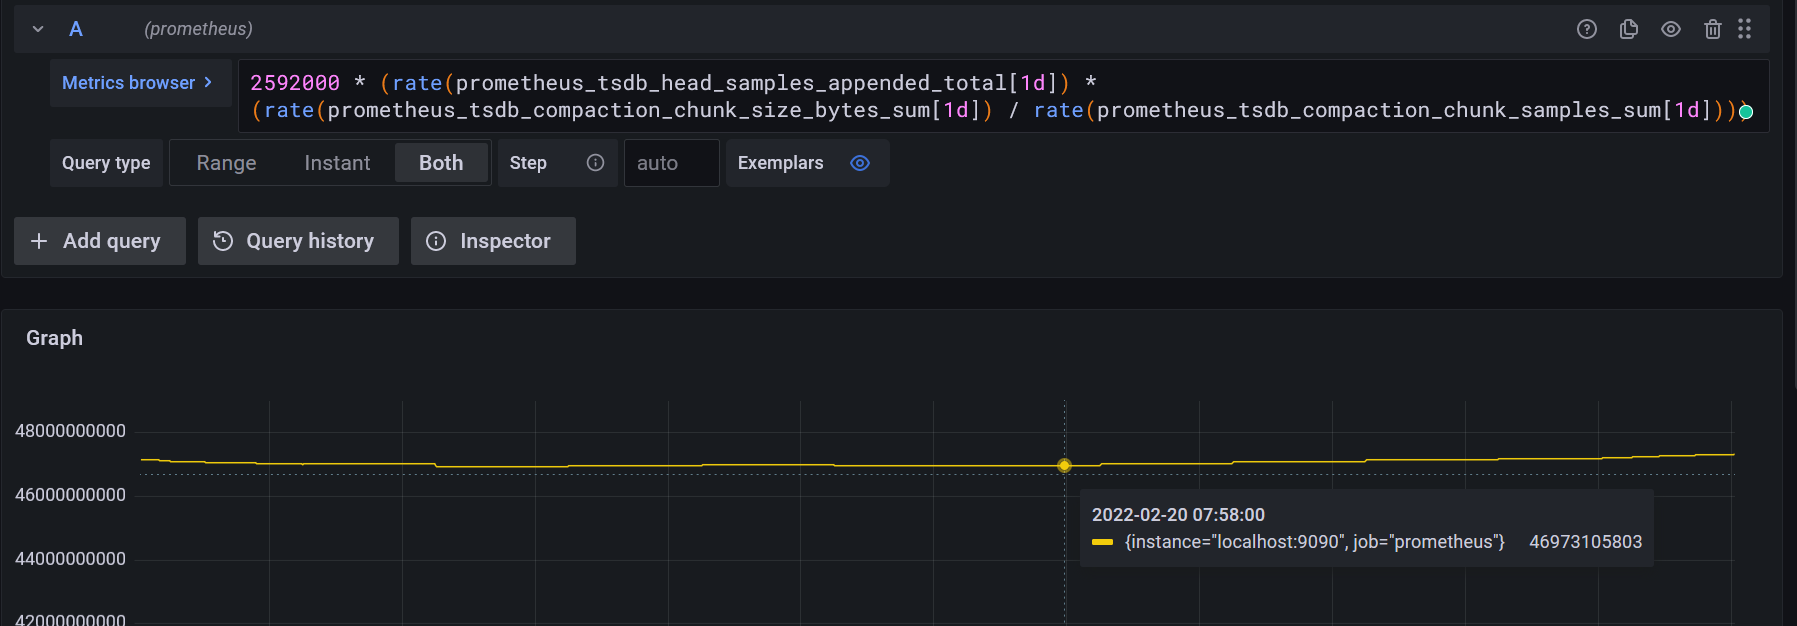
- Putting it all together :
2592000* (rate(prometheus_tsdb_head_samples_appended_total[1d]) *
(rate(prometheus_tsdb_compaction_chunk_size_bytes_sum[1d]) / rate(prometheus_tsdb_compaction_chunk_samples_sum[1d])))
2592000 : the retention period in seconds, in this case 30 days.
This gives us the value: 47335001801 bytes = 47.33GB
- To lower the rate of ingested samples, you can either reduce the number of time series you scrape (fewer targets or fewer series per target), or you can increase the scrape interval. However, reducing the number of series is likely more effective, due to the compression of samples within a series.
In case you want to play this around a bit, Grafana is generous enough to give a playground, you can run the queries there.
Reference :
https://prometheus.io/docs/prometheus/latest/storage/#storage