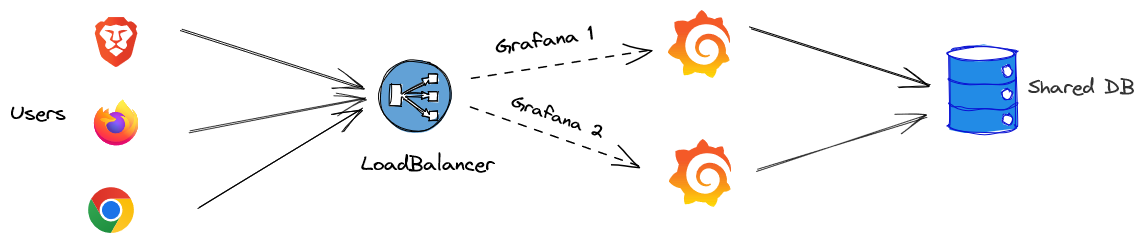
In this article, we’ll see how to setup Grafana with a remote database so that we can scale Grafana to N instances.
The default SQLite database will not work with scaling beyond 1 instance since the SQLite3 DB is embedded inside Grafana container.
Create Remote PostgreSQL using fly.io (Optional)
- For this demonstration, I’ll be using fly.io’s PostgreSQL service.
- Its free (no need to add credit card) and it has 1 GB of storage for DB and should be enough to try out with Grafana.
Note : If you already have a remote DB such as AWS RDS (or local DB) running, you can skip this step.
- First, download and install the
flyctlby referring this doc. - Create the account and sign in by referring to this doc.
- Create the DB cluster using the command :
flyctl postgres create- Set the name for the cluster :
grafana - Choose the region near to you, for example :
India - Select
Development - Single node, 1x shared CPU, 256MB RAM, 1GB disk
- Set the name for the cluster :
- After a minute, the cluster should get created and the username, password and URL will be visible like below, save it somewhere.
Postgres cluster grafana created
Username: postgres
Password: super-secret-pasword
Hostname: grafana.internal
Proxy Port: 5432
Postgres Port: 5433
- Now, the cluster is only accessible inside fly.io’s network since it doesn’t have a public address to reach over the internet.
- Use the below command to port-forward the DB connection to localhost at
5432:
flyctl proxy 5432 -a grafana

#expected output
Proxying local port 5432 to remote [grafana.internal]:5432
- You can connect to the DB using below command :
flyctl postgres connect -a grafana
Create Grafana Database
Since we’re using remote database, when the first time Grafana starts, it starts DB migration and that will fail if it can’t find a database called grafana.
Hence, let’s create the DB using the command below (via psql client) :
create database grafana;
Grafana with Docker-Compose
Once the DB is up and running, let’s create a docker-compose.yaml file for our Grafana:
version: '3'
services:
  grafana:
    image: grafana/grafana:9.0.7
    container_name: grafana
    ports:
    - 3000:3000
		environment:
      - GF_DATABASE_NAME=grafana
      - GF_DATABASE_USER=postgres
      - GF_DATABASE_PASSWORD=super-secret-password
      - GF_DATABASE_TYPE=postgres
      - GF_DATABASE_HOST=host.docker.internal:5432
Please update the environment variables as per your DB details.
Start Grafana container using the command :
docker-compose up -d
- Grafana should be running now and DB migration should start and logs will indicate that :
logger=sqlstore t=2022-08-20T15:24:28.83593716Z level=info msg="Connecting to DB" dbtype=postgres
logger=migrator t=2022-08-20T15:24:29.231523787Z level=info msg="Starting DB migrations"
logger=migrator t=2022-08-20T15:24:29.352920106Z level=info msg="Executing migration" id="create migration_log table"
logger=migrator t=2022-08-20T15:24:29.5825907Z level=info msg="Executing migration" id="create user table"
- Open Grafana by navigating to http://localhost:3000
Gotchas
- In the above example, I’ve mentioned DB host as
host.docker.internalsince my DB is accessible through localhost of the host machine. - If it’s AWS RDS or similar managed DB, just mention the DB connection URL and enable SSL verification.
- Regarding DB user, for this example, I haven’t created a separate DB user, but if you’re running a similar setup in production, it is highly advised that you create one.
Data Persistence in Docker
- Grafana v9 stores almost all data inside its database, including alert configurations.
- We can check that by listing the tables inside our Grafana database :
 Schema |            Name            | Type  |  Owner
--------+----------------------------+-------+----------
 public | alert                      | table | postgres
 public | alert_configuration        | table | postgres
 public | alert_notification         | table | postgres
 public | api_key                    | table | postgres
 public | dashboard                  | table | postgres
 public | dashboard_provisioning     | table | postgres
 public | data_source                | table | postgres
 public | org                        | table | postgres
 public | org_user                   | table | postgres
 public | permission                 | table | postgres
 public | preferences                | table | postgres
 public | team                       | table | postgres
 public | team_member                | table | postgres
 public | user                       | table | postgres
 public | user_auth                  | table | postgres
 public | user_auth_token            | table | postgres
 public | user_role                  | table | postgres
...
In case of docker, if the container restarts, none of your configurations or dashboards will be lost.
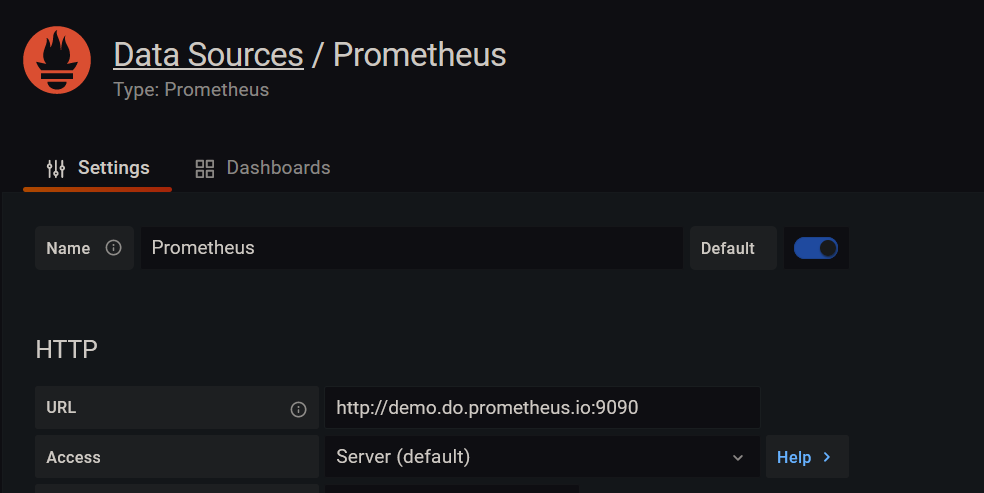
To test the persistence, let’s create a Prometheus data source :
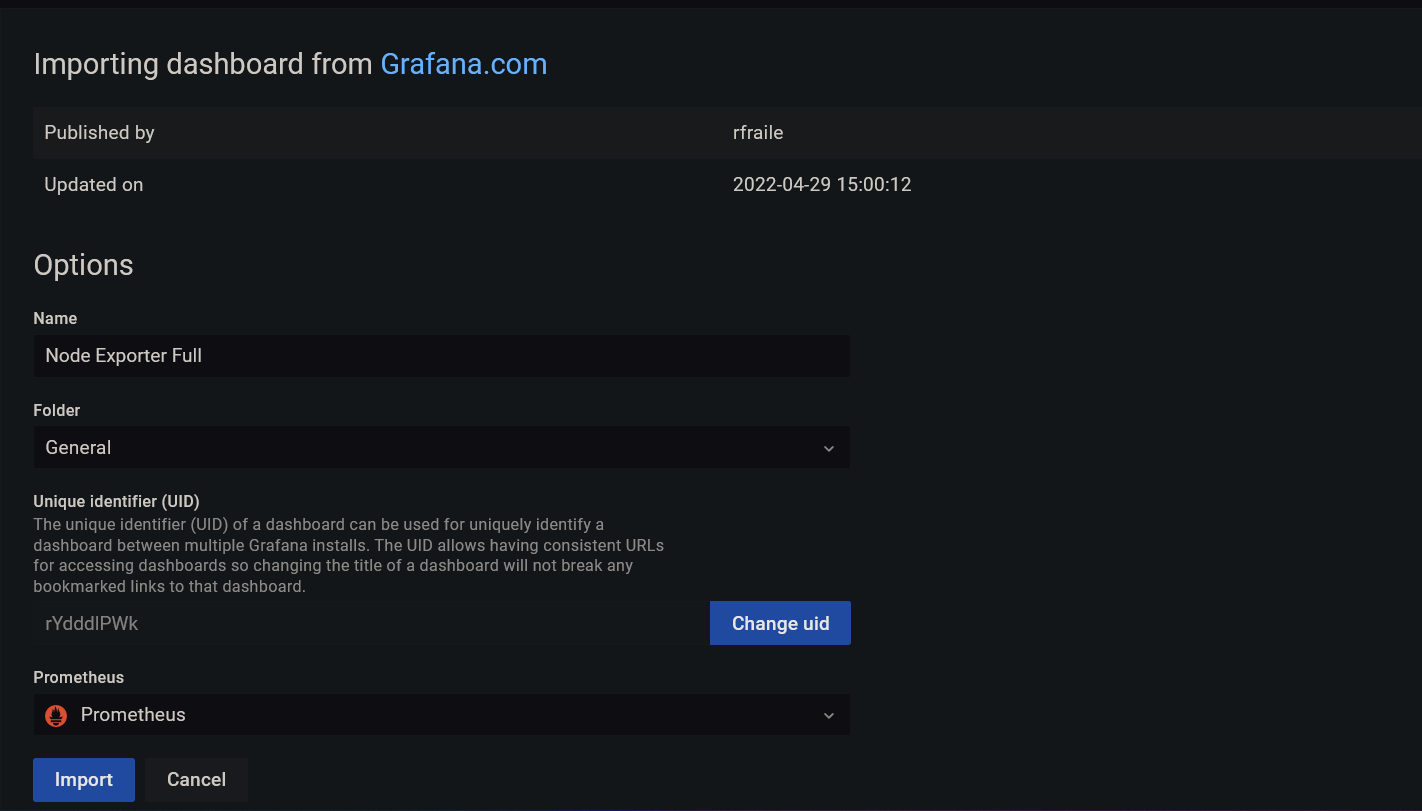
- Import the node exporter dashboard, Dashboard ID :
1860
- Now, you can test that by simply restarting the Grafana container :
docker-compose restart grafana - The logs should show something similar to below :
logger=settings t=2022-08-20T15:47:49.880986785Z level=info msg="App mode production"
logger=sqlstore t=2022-08-20T15:47:49.881148929Z level=info msg="Connecting to DB" dbtype=postgres
logger=migrator t=2022-08-20T15:47:54.783450339Z level=info msg="Starting DB migrations"
logger=migrator t=2022-08-20T15:47:55.043328627Z level=info msg="migrations completed" performed=0 skipped=426 duration=894.268µs
High Availability Grafana Setup in Docker
- To try our HA for Grafana in Docker, let’s create 2 grafana replicas behind an nginx proxy :
version: '3'
services:
  grafana:
    image: grafana/grafana:9.0.7
    expose:
      - "3000"
		environment:
      - GF_DATABASE_NAME=grafana
      - GF_DATABASE_USER=postgres
      - GF_DATABASE_PASSWORD=super-secret-password
      - GF_DATABASE_TYPE=postgres
      - GF_DATABASE_HOST=host.docker.internal:5432
    deploy:
      replicas: 2
  nginx:
    image: nginx:latest
    container_name: nginx
    volumes:
      - './nginx.conf:/etc/nginx/nginx.conf'
    depends_on:
      - grafana
    ports:
      - "8000:8000"
- If you look closely, we’ve exposed 3000 port from Grafana inside docker network and added Nginx as a proxy which will serve at port
8000. - Let’s create a file called
nginx.confso that it can forward the traffic to3000port of Grafana containers :
user  nginx;

events {
    worker_connections   1000;
}
http {
        server {
              listen 8000;
              location / {
                proxy_pass http://grafana:3000;
                proxy_set_header Host $http_host;
              }
        }
}
- Now, you can start this stack by running
docker-compose up -dand you can access Grafana by going to http://localhost:8000
Data Persistence & HA in Kubernetes
For this demo, I’ll be using minikube as my Kubernetes cluster.
First, let’s install Grafana using helm.
Run the below commands to add the Grafana helm repository to your cluster :
helm repo add grafana https://grafana.github.io/helm-charts
helm repo update
- Once added, create a file called
custom-values.yamland add the values :
grafana.ini:
  database:
    type: "postgres"
    host: "host.minikube.internal:5432"
    user: "postgres"
    password: "super-secret-pasword"
    name: "grafana"

replicas: 2
Note : Since my database is accessible at localhost, I’m using host has host.minikube.internal. If you’re using AWS RDS or a similar service, you should put the DNS address in the host section.
- Install Grafana helm chart using the below command :
helm install grafana grafana/grafana -f custom-values.yaml
Port forward Grafana service :
kubectl port-forward svc/grafana 80:80You can access the Grafana now by going to: http://localhost:80.
Any number of pods you scale up for Grafana, they all now will connect to a shared Database.
Gotchas
If you don’t have a shared database for Grafana and try to scale the replicas to > 1 it may result in unexpected results because by default each pod will have its own SQLite3 DB and they won’t be in sync.
For example, I have 2 Grafana replicas running without a shared database connection.
> kubectl get pod
NAME                      READY   STATUS    RESTARTS   AGE
grafana-975c48997-kw5vk   1/1     Running   0          65m
grafana-975c48997-sq9wl   1/1     Running   0          65m
After port-forwarding, I added a data source along with a dashboard for it.
The first pod is receiving traffic, and the second pod has no clue what’s happening on the other side.
"Request Completed" method=POST path=/api/ds/query status=400 remote_addr=127.0.0.1 time_ms=3247 duration=3.247032415s size=110 referer="http://localhost/d/rYdddlPWk/node-exporter-full?orgId=1&refresh=1m" traceID=00000000000000000000000000000000
logger=context traceID=00000000000000000000000000000000 userId=1 orgId=1 uname=admin t=2022-08-22T12:23:55.285644474Z level=info msg="Request Completed" method=POST path=/api/ds/query status=400 remote_addr=127.0.0.1 time_ms=3247 duration=3.247181905s size=110 referer="http://localhost/d/rYdddlPWk/node-exporter-full?orgId=1&refresh=1m" traceID=00000000000000000000000000000000
Whenever the request is sent to the second pod, connection gets logged out with auth error since in that pod, data doesn’t exist.
#first pod
level=info msg="Successful Login" User=admin@localhost

#second pod
level=error msg="Failed to look up user based on cookie" error="user token not found"
To keep it fair, I even observed the traffic flow to those pods using Linkerd. As you can see, the requests are almost equally balanced between pods :
linkerd viz stat pod grafana-55d88bb8b9-445dk grafana-55d88bb8b9-mrnf9
NAME                        STATUS   MESHED   SUCCESS      RPS   LATENCY_P50   LATENCY_P95   LATENCY_P99   TCP_CONN
grafana-55d88bb8b9-445dk   Running      1/1   100.00%   1.1rps           2ms          50ms          89ms         11
grafana-55d88bb8b9-mrnf9   Running      1/1   100.00%   1.6rps           2ms          18ms          77ms          9
Bonus
You can run a load test on your Grafana setup using K6 and scale accordingly with the results.
Additional Note : You can run a local PostgreSQL and use that as your DB as well, no need to use AWS RDS or similar kind. The only added advantage with Managed Databases is that there’s no operational overhead.
References
https://grafana.com/docs/grafana/latest/setup-grafana/set-up-for-high-availability/
https://fly.io/docs/reference/postgres/
https://minikube.sigs.k8s.io/docs/handbook/host-access/
https://github.com/grafana/grafana/blob/main/devenv/docker/ha_test