Push vs Pull
Prometheus is by far the best OSS you can get in 2022 for self-hosted / SaaS monitoring.
There are other solutions that grew out of Prometheus for ex Thanos or Cortex.
I believe the reason for this is the simplicity that Prometheus offers for querying the metrics and the way it handles millions of time series.
Before we jump into the implementation, let’s learn a bit about Prometheus Pull based mechanism for monitoring. Here’s how they explain:
Pulling over HTTP offers several of advantages:
- You can run your monitoring on your laptop when developing changes.
- You can more easily tell if a target is down.
- You can manually go to a target and inspect its health with a web browser.
Overall, we believe that pulling is slightly better than pushing, but it should not be considered a major point when considering a monitoring system.
One of the main problem where pull based mechanism won’t work is when
Prometheus cannot directly reach the server to scrape metrics from it.
For this problem, push based mechanism comes to play. A bit about it :
- With a pull model, it is straightforward to determine whether a node is available using an up metric with a value of 1 when the target is reachable and 0 when it is not.
- With the push model, the up metric has a value of 1 when the server is running and no value at all when it is not. This distinction is important when monitoring whether your monitoring system is running as expected.
Solution : Grafana agent + Remote write
1. Configuring Prometheus as remote receiver endpoint
- As of Prometheus v2.33.3, this feature is supported, and you can pass flag
-web.enable-remote-write-receiverand your server endpoint example.com/api/v1/write will accept remote metrics. - Here’s how the config looks if you’re running Prometheus in Kubernetes :
- name: prometheus-server
      image: quay.io/prometheus/prometheus:v2.33.3
      args:
        - '--storage.tsdb.retention.time=15d'
        - '--config.file=/etc/config/prometheus.yml'
        - '--storage.tsdb.path=/data'
        - '--web.console.libraries=/etc/prometheus/console_libraries'
        - '--web.console.templates=/etc/prometheus/consoles'
        - '--web.enable-lifecycle'
        - '--web.enable-remote-write-receiver'
2. Configuring Grafana Agent
Grafana Agent is actually Prometheus lite 😛. It just collects and pushes metrics to a remote server.
Note: I’ll be running Grafana Agent in docker, but there wont be much change to running it via systemd.
- First would be to create the agent configuration file (
agent.yaml) :
server:
  log_level: info
  http_listen_port: 12345

metrics:
  global:
    scrape_interval: 30s
    external_labels:
      environment: test-server
  configs:
    - name: default
      scrape_configs:
        - job_name: agent
          static_configs:
            - targets: ['grafana-agent:12345']
        - job_name: 'node_exporter'
          static_configs:
          - targets: ['node_exporter:9100']
        - job_name: 'cadvisor'
          static_configs:
          - targets: ['cadvisor:8080']
      remote_write:
        - url: https://example.com/api/v1/write
          basic_auth:
            username: admin
            password: secret-password
- This config is almost identical to a regular Prometheus configuration file.
scrape_interval: Time interval at which agent should scrape / collect the metrics.external_labels: Label which you can add for all metrics agent sends to Prometheus for easier identification and analysis later ( key-pair) .- We have 3 scrape Jobs in
scrape_configs. Each Job tells Prometheus what & where to scrape. remote_writeis where the magic happens, its the location where agent should send the metrics it collected.Basic_auth: Basic Authentication for authenticating with the/api/v1/writeendpoint.- Basic Auth is not a Mandatory Option, but it sure is necessary, else you’re endpoint will be open to public !!!
- Prometheus needs to be configured with Basic auth initially. Please follow this doc to set it up.
Once the config file is completed, you can use the below Docker-compose file to get started with the Grafana agent + cadvisor ( container metrics) + node-exporter ( machine metrics) :
version: "3"

services:
  grafana-agent:
    image: grafana/agent:v0.23.0
    container_name: grafana-agent
    volumes:
      - /path/to/data/:/etc/agent/data
      - /path/to/agent.yaml:/etc/agent/agent.yaml

  node-exporter:
    image: prom/node-exporter:v1.3.1
    container_name: node_exporter
    command:
      - '--path.rootfs=/host'
    network_mode: host
    pid: host
    volumes:
      - '/:/host:ro,rslave'

  cadvisor:
    image: gcr.io/cadvisor/cadvisor
    container_name: cadvisor
    volumes:
      - /sys:/sys:ro
      - /:/rootfs:ro
      - /var/run:/var/run:rw
      - /var/lib/docker/:/var/lib/docker:ro
      - /dev/disk/:/dev/disk:ro
- For Grafana Agent, the volume folder needs to be created before running the
docker-compose upcommand. - Grafana agent needs data folder because in-case the agent container restarts, it can resend the metrics which couldn’t be sent earlier.
- It stores metrics up-to last 1 hour. in-case you think it’s too much you can configure metrics DROP for the time series which are not needed in Grafana config file itself Doc.
Once both of the above steps are complete, you can check if metrics are being pushed to your Prometheus server by running the below queries :
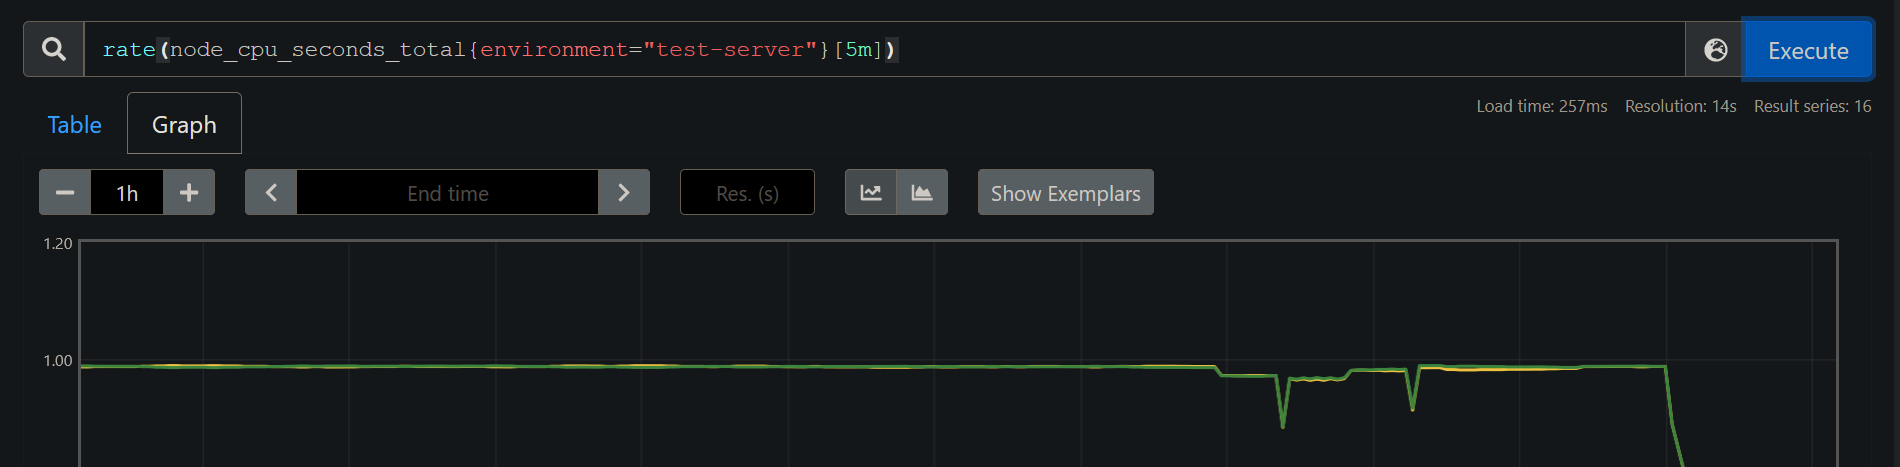
For Node metrics, run the PromQL query :
rate(node_cpu_seconds_total{environment="test-server"}[5m])
which should look like :
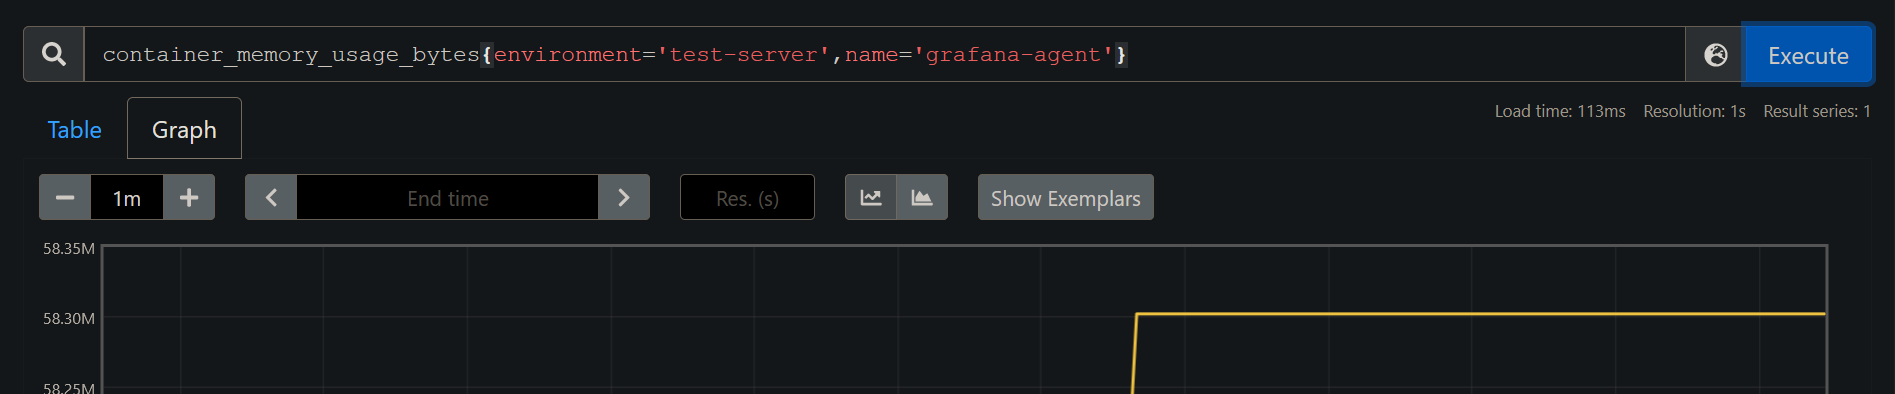
For Container metrics, run the PromQL query :
container_memory_usage_bytes{environment='test-server',name='grafana-agent'}
Now it’s up to the DevOps engineer to write useful PromQL queries, Create Grafana dashboards and configure alerts for the same to make use of these metrics.