Keeping your Prometheus optimized can be a tedious task over time, but it’s essential in order to maintain the stability of it and also to keep the cardinality under control.
Identifying the unnecessary metrics at source, deleting the existing unneeded metrics from your TSDB regularly will keep your Prometheus storage & performance intact.
In this article we’ll look at both identifying, dropping them at source and deleting the already stored metrics from Prometheus.
Identifying the costly metrics :
There are 3 ways in which you can get the top 10 costly metrics which are consuming your TSDB :
- Via promtool:
- Promtool is bundled with Prometheus, if you’re running Prometheus in Kubernetes, then you can just exec into the pod and run the below command.
- If you’re running Prometheus in VMs, the Promtool binary will be in the same directory as Prometheus.
Command : promtool tsdb analyze path-to-data-directory/.
/prometheus $ promtool tsdb analyze /data/

Block ID: 01FYV026P5AYM47XSSFT4WVG6X
Duration: 1h59m59.999s
Series: 173756
Label names: 321
Postings (unique label pairs): 18485
Postings entries (total label pairs): 3000877

Label pairs most involved in churning:
32894 namespace=default
14131 job=kubernetes-nodes-cadvisor
13606 job=kubernetes-service-endpoints

Label names most involved in churning:
35344 __name__
35022 instance
35022 job
34345 namespace
28503 pod
15626 container

Most common label pairs:
82253 namespace=default
54338 job=linkerd-proxy
54338 control_plane_ns=linkerd
52074 job=kubernetes-service-endpoints
51637 app_kubernetes_io_managed_by=Helm
41292 kubernetes_io_os=linux

Label names with highest cumulative label value length:
187875 id
116231 name
83663 __name__
67642 path
67233 container_id
41271 image
31047 image_id
25053 filename
23436 uid
21800 pod

Highest cardinality labels:
2227 __name__
1846 id
1369 name
921 container_id
844 replicaset
733 owner_name

Highest cardinality metric names:
20280 response_latency_ms_bucket
10140 route_response_latency_ms_bucket
5076 etcd_request_duration_seconds_bucket
3380 control_response_latency_ms_bucket
2079 stack_poll_total
1893 container_memory_usage_bytes
1893 container_memory_working_set_bytes
1893 container_cpu_user_seconds_total
1893 container_memory_max_usage_bytes
1893 container_memory_rss
1893 container_cpu_system_seconds_total
1745 tcp_open_total
1745 tcp_read_bytes_total
1745 tcp_open_connections
1745 tcp_write_bytes_total
1700 container_cpu_usage_seconds_total
1474 rest_client_request_latency_seconds_bucket
1424 route_request_total
1295 kube_pod_container_resource_requests
1260 http_client_request_latency_seconds_bucket
- Via
/tsdb-statusendpoint:
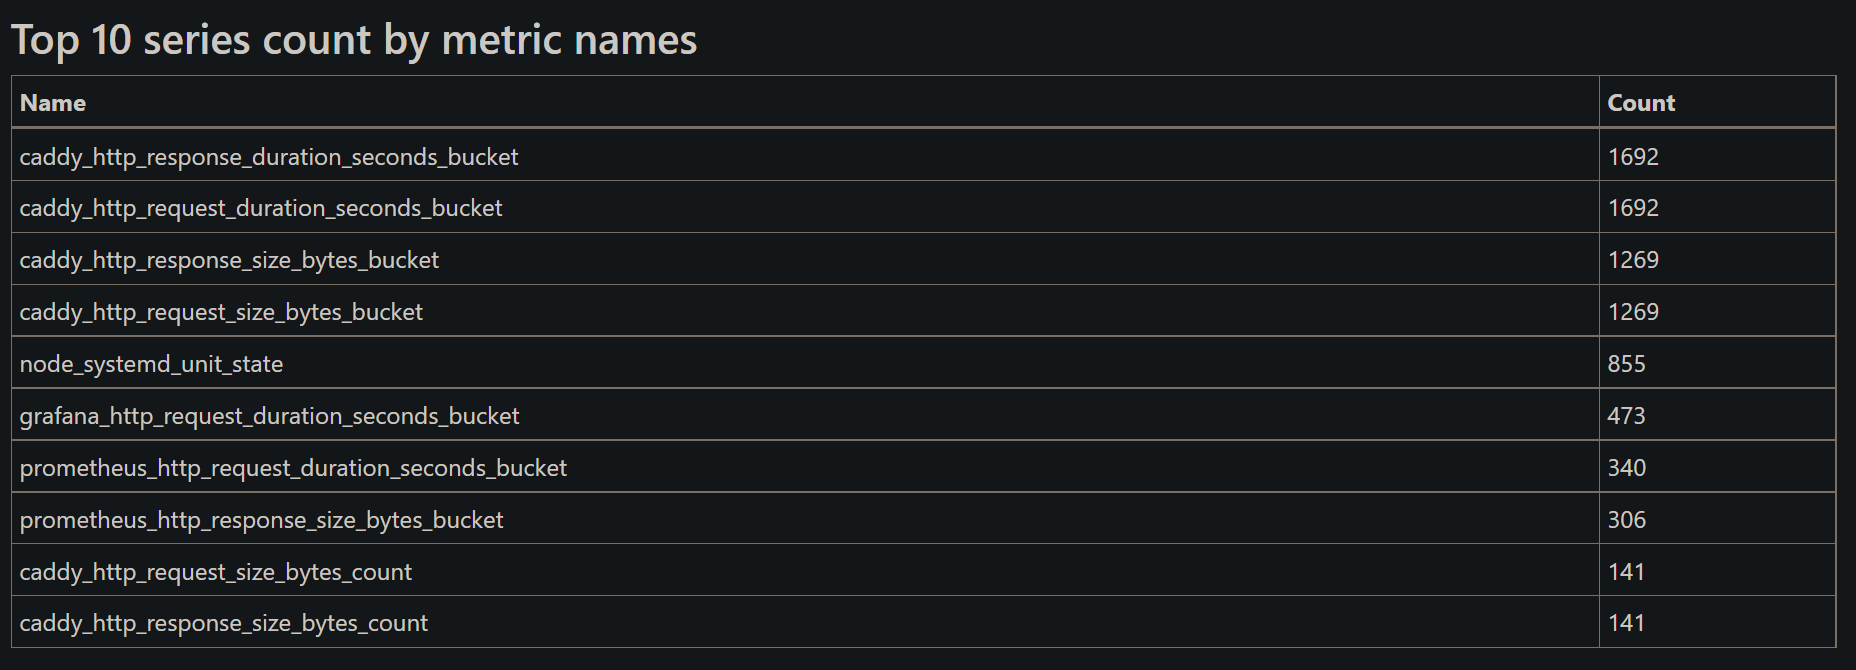
Prometheus already provides outputs of the above tsdb analyze command in easy to understand manner at prometheus-example.com/tsdb-status endpoint.
- There are more details about the label pairs etc. on that endpoint, but for the scope of this article, we’ll focus on the top 10 series count by metric name.
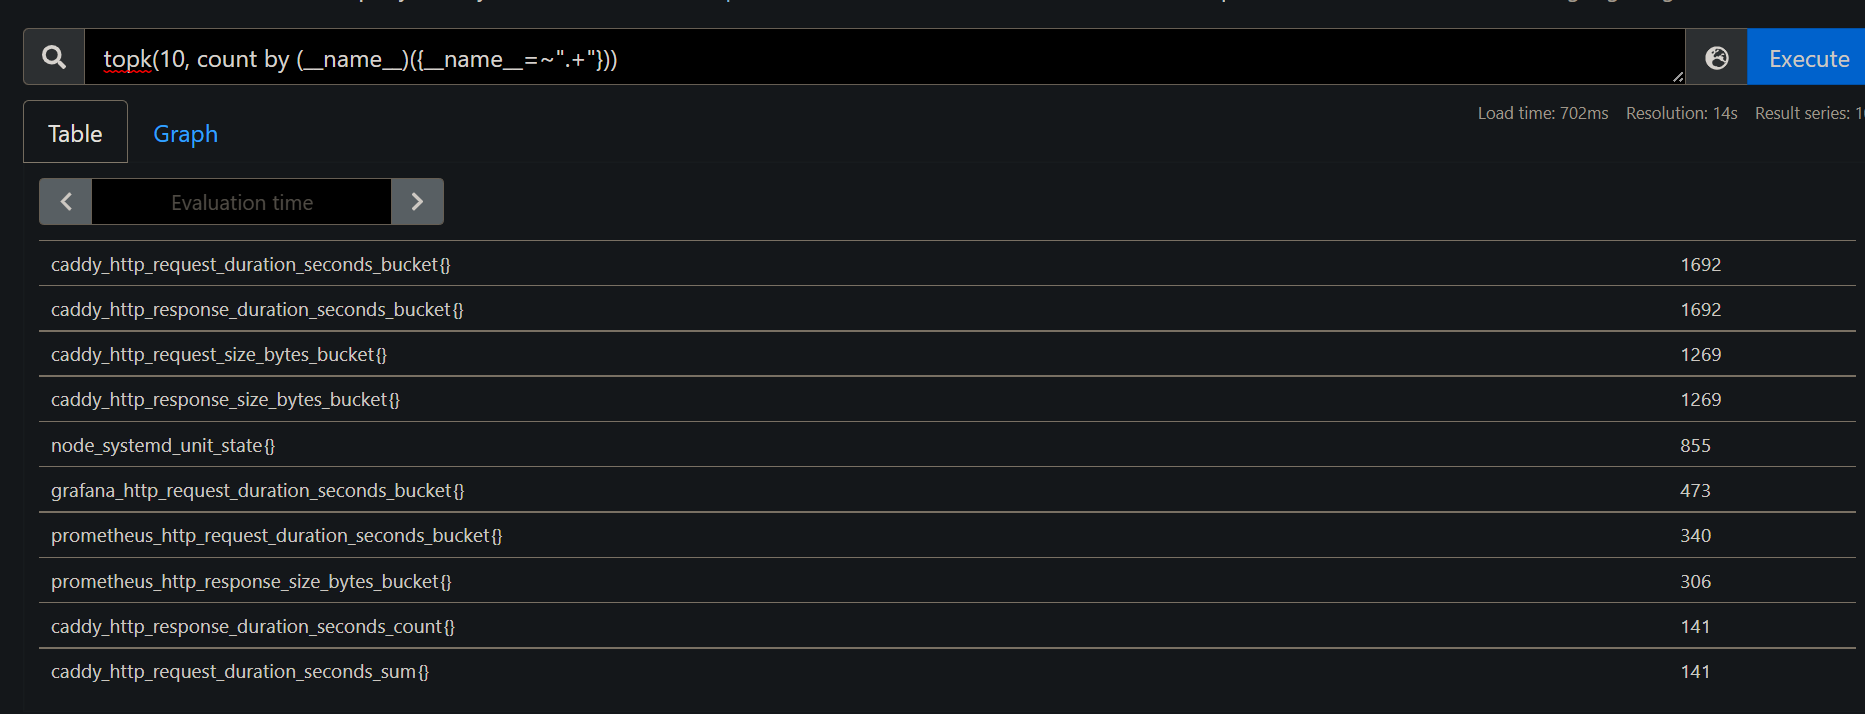
- Via PromQL query:
- If you’re more fond of PromQL to get things done, the above result can also be achieved by running the PromQL query :
topk(10, count by (__name__)({__name__=~".+"}))
- From the above pointers, now we know what are our costly metrics which we need to be aware of.
Let’s assume we decided that we want to drop prometheus_http_request_duration_seconds_bucket & prometheus_http_response_size_bytes_bucket metric, as it’s of no practical use to us.
1. Drop
In order to drop the above-mentioned metrics, we need to add metric_relabel_configs in Prometheus scrape config with the metric name we need to drop :
scrape_configs:
  - job_name: "prometheus"
    scrape_interval: 15s
    static_configs:
    - targets: ["localhost:9090"]
    metric_relabel_configs:
    - source_labels: [__name__]
      regex: '(prometheus_http_request_duration_seconds_bucket|prometheus_http_response_size_bytes_bucket)'
      action: drop
complete flow will be like :
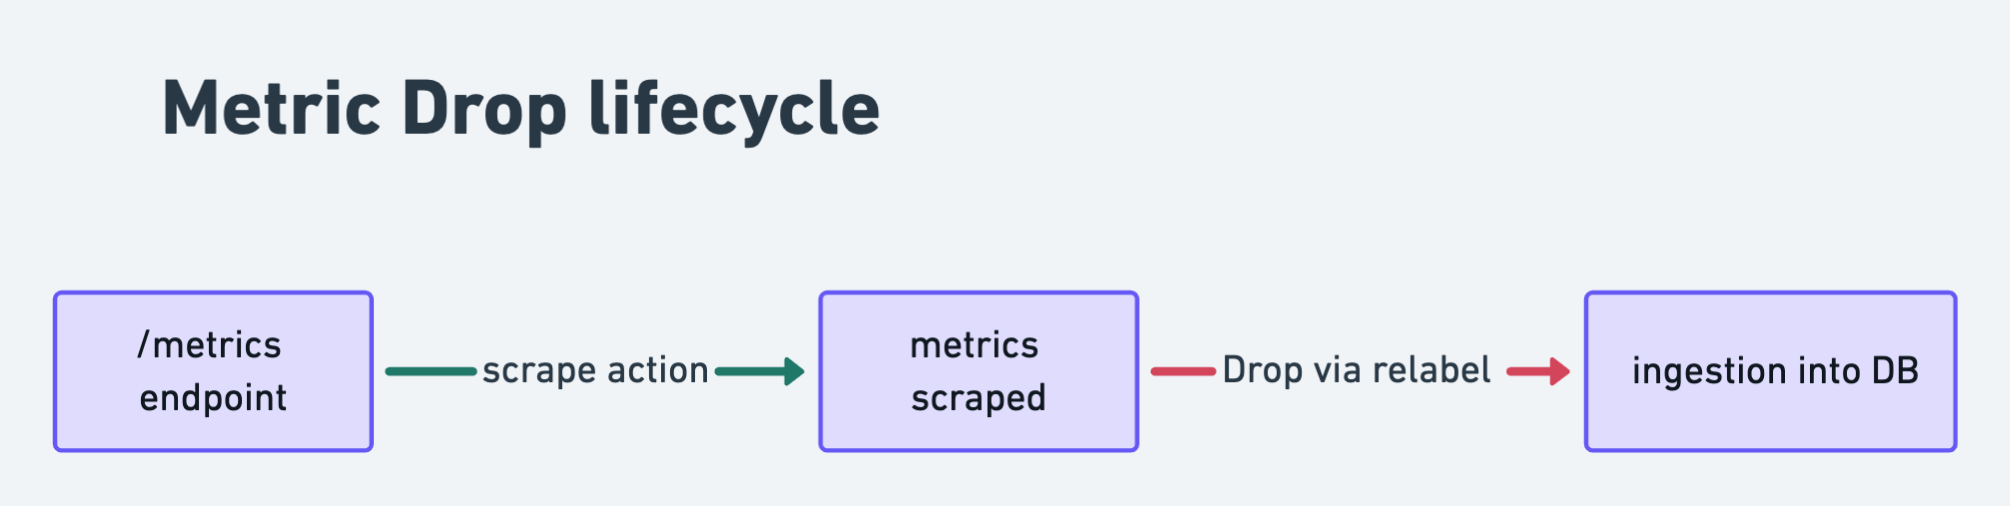
metric_relabel_configs: metric relabeling process starts once the metrics is scraped. The reason for that is, the main label__name__will be generated post scraping.source_labels: we’re utilizing the label__name__to get the desired metric, since this itself is a label which has value of metric name. i.e__name__=prometheus_http_request_duration_seconds_bucket
If you have lots of metrics which you need to drop, a better approach would be to use the action “keep” and mention the metric names you need to keep and everything else will be dropped.
2. Keep
- As mentioned above, let’s try the permissive approach of Prometheus.
- Here we will be only keeping metric
prometheus_http_requests_totaland drop everything else. The config looks like this :
scrape_configs:
  - job_name: "prometheus"
    scrape_interval: 5s
    static_configs:
    - targets: ["localhost:9090"]
    metric_relabel_configs:
    - source_labels: [__name__]
      regex: prometheus_http_requests_total
      action: keep
Gotchas
- Once you have dropped the metric of choice, new samples won’t get stored for that metric.
- When a metric is not receiving any samples for ~5 min, it will be considered as a stale metric. You can read more about staleness here.
- Depending on your retention period, the old time series will be removed once it reaches the retention, by default it’s 15 days.
- However, if you want to delete the stored metrics to clear up space, you can follow the below steps to achieve that.
Deletion of single metric:
- In order to delete a series based on label, first you need to enable Admin API. You can enable the flag
-web.enable-admin-apito do that. The complete command will look like this :
./prometheus --web.enable-admin-api
- Send a POST request with the label selectors of your choice to delete the resulting time series from starting date till today, i.e, everything for that time series.
For example, the below will delete prometheus_http_requests_total from all scrape job (if there were multiple).
curl -X POST -g 'http://localhost:9090/api/v1/admin/tsdb/delete_series?match[]=prometheus_http_requests_total'
In case you need to delete a metric from a specific scrape job, you can mention the job label.
-g 'http://localhost:9090/api/v1/admin/tsdb/delete_series?match[]=prometheus_http_requests_total{job="prometheus"}'
- The above step will mark the time series for deletion, but won’t remove them from the disk at that moment. They will get flushed in future compaction.
- If you need to remove them from the disk to clear the space instantly, you can hit the tombstone endpoint to purge the time series from the disk :
curl -XPOST http://localhost:9090/api/v1/admin/tsdb/clean_tombstones
Deletion of multiple metrics:
- If you’re cleaning / optimizing your Prometheus TSDB, deleting a single metric won’t do anything.
- Hence, deletion of 100s if not 1000s of unnecessary time series is evident.
- At of the time writing this article, you can’t delete n metrics which are matched by regular expression.
- I found a workaround for that via shell scripting for multiple metric deletion at a single shot.
Example :
There are around 66 go based metrics which are available at Prometheus /metrics endpoint.
- If you want to delete all of them, then you can perform the below steps, since regex based deletion is not possible as of now.
- The below command will grab all the metrics which starts with
go_.
# get all metric name with go_* into a txt file.
curl http://localhost:9090/api/v1/label/__name__/values | tr ',' '\n' | tr -d '"' | grep '^go_.*' > prom_go_metrics.txt
- The metrics collected in file will look like :
cat prom_go_metrics.txt | head -n 5

go_gc_cycles_forced_gc_cycles_total
go_gc_cycles_total_gc_cycles_total
go_gc_duration_seconds
go_gc_duration_seconds_count
go_gc_duration_seconds_sum
- Create a bash script delete-metrics.sh, append the below contents and run it :
#shell script to go over each metric in the file and request the API for deletion recursively.

#!/bin/bash
for i in `cat prom_go_metrics.txt`; do
        curl -X POST -g 'http://localhost:9090/api/v1/admin/tsdb/delete_series?match[]='$i''
done
- If the deletion is successful, the response will be empty.
- Once the deletion is successful, use Promtool to query metrics via CLI or check via web UI to see if the metric returns any value. The response should be empty.
promtool query series http://localhost:9090 --match=go_gc_heap_allocs_by_size_bytes_total
References :