In this article, let’s go over some common metric sources and how to prevent the explosion of the metrics over time from them in Prometheus.
1. Node exporter:
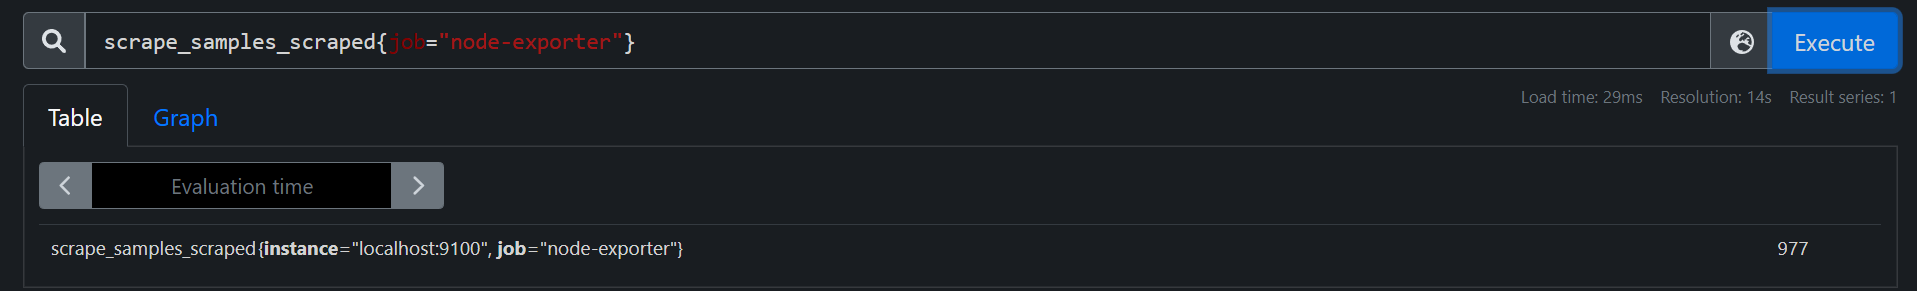
- Node exporter by default exposes ~ 977 different metrics per node. Depending on labels, this can easily by default create 1000 time series the moment node-exporter is started.
- Although 1000 metrics per node doesn’t look huge at the beginning, but if you’re sending these metrics to any cloud vendor like Grafana cloud, AWS Prometheus and Google Cloud for Prometheus, this can be unnecessary cost burn as all cloud vendors calculate cost based on number of time series sent & stored.
- It’s not necessary that you should cut down on metric scraping if you’re sending metrics to any of the vendors mentioned above.
- This also implies to local storage of Prometheus data, since too many time series over time can hinder Prometheus performance.
What’s a collector ?
- Main components of a node are referred to as collector, for example CPU, file-system, memory etc.
- Each collector exposes a set of metrics about the component it covers. Here’s the list of collectors that are enabled by default.
- Disable collectors :
- A collector can be disabled by providing the flag :
--no-collector.<collector-name>
#the command will look like this :

node_exporter --no-collector.nfs
- Disable self metrics of node-exporter :
- Node-exporter exposes ~ 80 metrics about itself at
/metricsalong with node metrics. - The metrics about node-exporter starts with prefix
promhttp_*, process_*, go_*. Below is the list of some of them :
process_cpu_seconds_total
process_max_fds
process_open_fds
process_resident_memory_bytes
process_start_time_seconds
process_virtual_memory_bytes
process_virtual_memory_max_bytes
promhttp_metric_handler_errors_total
promhttp_metric_handler_requests_in_flight
promhttp_metric_handler_requests_total
.
.
& around 68 go based metrics.
- You can disable all the above ~80 metrics by running node-exporter with flag
-web.disable-exporter-metrics
#the command will look like this :

node_exporter --web.disable-exporter-metrics
- Enable only the collectors required :
- Opposite to disabling certain collectors, Node exporter has a flag
--collector.disable-defaultswhich disables all collectors at once. - Combining that flag with the collector of your choice will only collect the metrics of the collectors you enabled and discard everything else.
For example, If you want to collect only the CPU and Memory metrics of a node, you can run the below command :
node_exporter --collector.disable-defaults --collector.cpu --collector.meminfo
- Filter collectors via scrape config:
- This is especially useful when you don’t have control over the nodes & have around 100’s of nodes where changing the config on each of them is not feasible.
- You can mention the names of the collectors which you want to enable (i.e., to be scraped) at scrape config of Prometheus, and all metrics from other collectors will be dropped.
- Below is an example Prometheus config:
# scrape config to collect only cpu & memory metrics via node-exporter.
scrape_configs:
  - job_name: 'node_exporter'
    static_configs:
    - targets: ['localhost:9100']
    params:
      collect[]:
        - cpu
        - meminfo
2. cAdvisor
cAdvisor (Container Advisor) is a running daemon that collects, aggregates, processes, and exports information about running containers.
- Disable metrics:
- Similar to collectors, you can also disable metrics by passing flag :
--disable_metrics - Below is an example argument which disables a bunch of metric sources :
--disable_metrics=accelerator,percpu,sched,resctrl,sched,process,hugetlb,referenced_memory,cpu_topology,memory_numa,tcp,advtcp,resctrl,udp'
An example docker-compose file consisting Prometheus & cAdvisor :
version: '3.2'
services:
  prometheus:
    image: prom/prometheus:latest
    container_name: prometheus
    ports:
    - 9090:9090
    command:
    - --config.file=/etc/prometheus/prometheus.yml
    volumes:
    - ./prometheus.yml:/etc/prometheus/prometheus.yml:ro
    depends_on:
    - cadvisor
  cadvisor:
    image: gcr.io/cadvisor/cadvisor:latest
    container_name: cadvisor
    ports:
    - 8080:8080
    volumes:
    - /:/rootfs:ro
    - /var/run:/var/run:rw
    - /sys:/sys:ro
    - /var/lib/docker/:/var/lib/docker:ro
    command:
      - '--disable_metrics=accelerator,percpu,sched,resctrl,sched,process,hugetlb,referenced_memory,cpu_topology,memory_numa,tcp,advtcp,resctrl,udp'
Prometheus config to scrape cAdvisor metrics, prometheus.yml :
scrape_configs:
- job_name: cadvisor
  static_configs:
  - targets:
    - cadvisor:8080
- Drop costly metrics :
Let’s find out what are the top 10 costly metrics by cAdvisor. We can get that result by running the below promQL expression :
#syntax
topk(10, count by (__name__)({__name__=~".+",job="cadvisor_job_name"}))

#example
topk(10, count by (__name__)({__name__=~".+",job="kubernetes-nodes-cadvisor"}))
- Which will look like this :
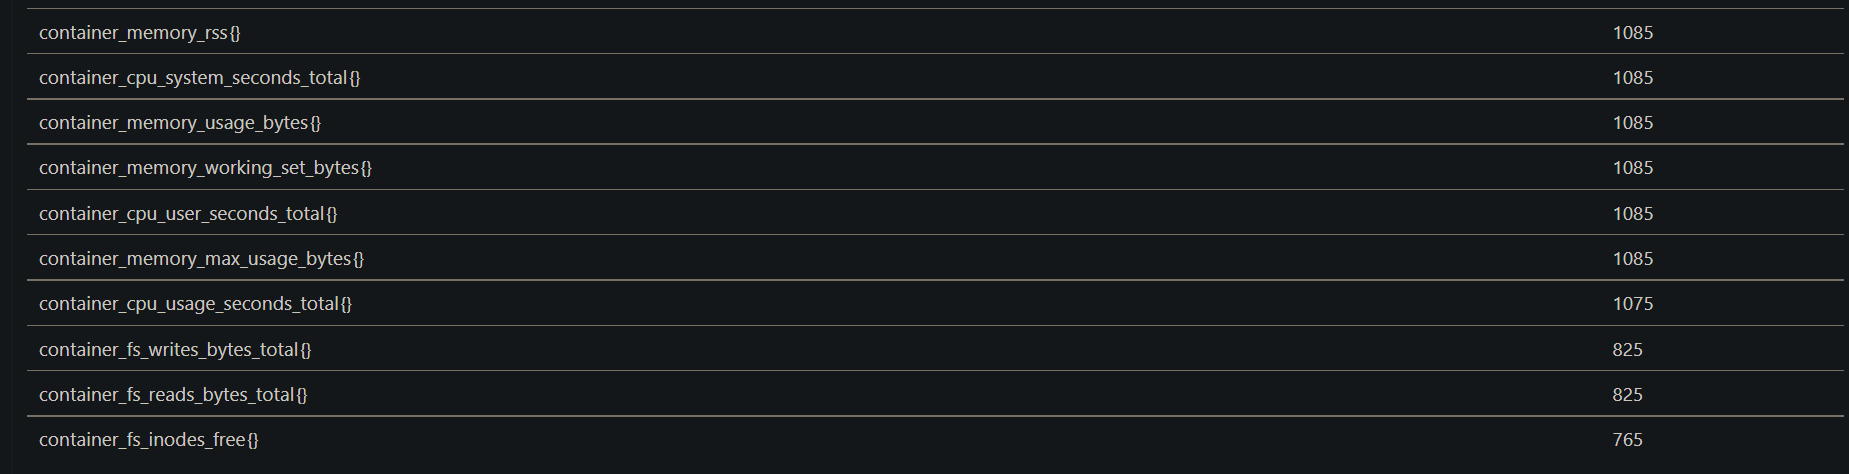
- Let’s say we want to drop
container_memory_rssmetrics. - We can utilize Prometheus metric relabeling on this. Update the below to Prometheus scrape config :
scrape_configs:
  - job_name: "cadvisor"
    scrape_interval: 15s
    static_configs:
    - targets: ["cadvisor:8080"]
    metric_relabel_configs:
    - source_labels: [__name__]
      regex: '(container_memory_rss)'
      action: drop
You can refer my article on Prometheus metrics drop & deletion to understand more about this.
3. kube-state-metrics
kube-state-metrics (KSM) is a simple service that listens to the Kubernetes API server and generates metrics about the state of the objects. It is not focused on the health of the individual Kubernetes components, but rather on the health of the various objects inside, such as deployments, nodes, and pods.
- Disable Collectors:
- Just like the above-mentioned services, kube-state-metrics also has collectors which collect metrics about specific components like statefulset, daemonset, PVC etc.
- You can find the list of collectors here.
- All collectors are enabled by default, which in most scenarios not needed.
- You can enable only the collectors you need ( i.e., disable others) by mentioning them via flag
--resources.
Here’s how it looks :
image: k8s.gcr.io/kube-state-metrics/kube-state-metrics:v2.3.0
      args:
        - --resources=deployments,persistentvolumeclaims,pods,services,statefulsets
- Metric denylist :
- Suppose you have a metric called
kube_deployment_spec_strategy_rollingupdate_max_surgewhich created 1000s of time series which is not-useful. - In this case, you can add that metric to denylist of kube-state-metrics with flag
--metric-denylistand that metric won’t be scraped or collected. --metric-denylistflag also accepts regex if you want to deny multiple matching metrics at once. For example:
image: k8s.gcr.io/kube-state-metrics/kube-state-metrics:v2.3.0
      args:
        - --metric-denylist=kube_deployment_spec_.*