 I’ve recently got a gaming laptop and monitoring the CPU & GPU temperature of it has been a tedious task, like install MSI Afterburner, configure statistics server, configure overlay etc.
That made me use Grafana’s product suite to configure monitoring of key components such as CPU, GPU, Network, Disk and alerting for my laptop such that I can game in peace and when my laptop’s temperature reaches a certain threshold limit, I’ll get a phone call.
Install and Configure OhmGraphite
OhmGraphite is a Windows service that exposes hardware sensor data to a metric store, allowing one to observe health and status of one’s system over below components:
- Power consumption of the CPU and GPU
- CPU voltages and frequencies
- Load breakdown on individual GPU components
- CPU, GPU, disk, and motherboard temperature readings
- Disk activity, space overview
- Network consumption
Lets install and configure OhmGraphite in our laptop :
- Create a directory that will be the base directory for OhmGraphite (like
C:\Program Files\OhmGraphite). - Download the latest zip and extract to
C:\Program Files\OhmGraphite. - Next, we need to update the app configuration so that the app can scrape the laptop metrics and expose it at
localhost:4445/metrics. In order to do that, edit the fileOhmGraphite.exe.configand update it with below values :
<?xml version="1.0" encoding="utf-8" ?>
<configuration>
  <appSettings>
    <add key="type" value="prometheus" />
    <add key="prometheus_port" value="4445" />
    <add key="prometheus_host" value="localhost" />
  </appSettings>
</configuration>
- We need the above changes since the app can expose metrics in metric stores for example, Graphite, Prometheus & even push to TimescaleDB & InfluxdDB.
- Install the app by running the command
.\OhmGraphite.exe install.
- This command will install OhmGraphite as a Windows service.
- Now, we can start the OhmGraphite service by running the below command :
#PowerShell
start-Service OhmGraphite

#CommandLine
sc start OhmGraphite
- You can curl the endpoint http://localhost:4445/metrics and the scraped metrics are listed there.
#Sample response

curl http://localhost:4445/metrics

# HELP ohm_gpunvidia_bytes Metric reported by open hardware sensor
# TYPE ohm_gpunvidia_bytes gauge
ohm_gpunvidia_bytes{hardware="NVIDIA GeForce RTX 3050 Laptop GPU",sensor="GPU Memory Used",} 1072693248
ohm_gpunvidia_bytes{hardware="NVIDIA GeForce RTX 3050 Laptop GPU",sensor="GPU Memory Free""} 3221225472
ohm_gpunvidia_bytes{hardware="NVIDIA GeForce RTX 3050 Laptop GPU",sensor="GPU Memory Total"} 4294967296
ohm_gpunvidia_bytes{hardware="NVIDIA GeForce RTX 3050 Laptop GPU",sensor="D3D Shared Memory Used"} 69447680
Install and Configure Grafana Agent
- Download and install Grafana Agent for Windows from this link (latest release).
- Once it’s installed, edit the file
C:\Program Files\Grafana Agent\agent-config.yamland update the below values :
metrics:
  global:
    scrape_interval: 60s
  wal_directory: /tmp/grafana-agent-wal
  configs:
  - name: laptop_exporter
    remote_write:
    - basic_auth:
        password: <your-grafana-cloud-api-key>
        username: <your-grafana-cloud-username-id>
      url: <your-grafana-cloud-prometheus-push-endpoint>
    scrape_configs:
    - job_name:  laptop_exporter
      static_configs:
      - targets: ["localhost:4445"]
- I’ve kept the
scrape_intervalto 1 minute. You can update to lower value(like 30s) if you need the values to be updated quicker. - Job name can be anything you want. Better to keep something identifiable and meaningful.
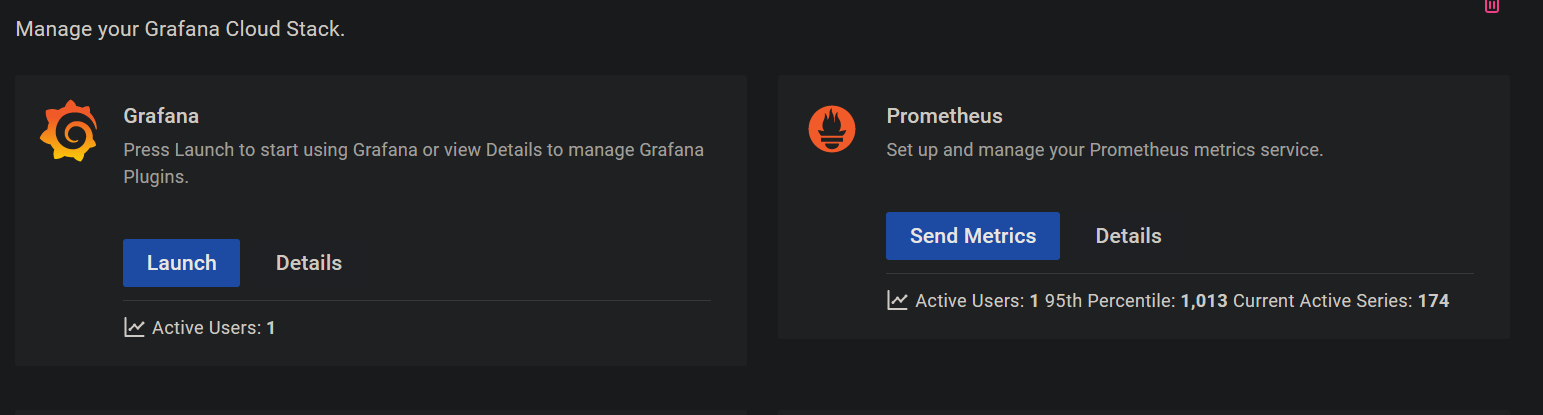
- If you already have a Grafana Cloud account, then you can get the API Key, User-ID, & the Prometheus metrics push endpoint at your Prometheus stack page :
- Restart the Grafana Agent to update your new config :
#PowerShell
Restart-Service 'Grafana Agent'

#CommandLine
sc stop 'Grafana Agent'
sc start 'Grafana Agent'
- Verify that Agent is able to recognize the target and scraping the metrics :
curl -s http://localhost:12345/agent/api/v1/metrics/targets | jq

{
  "status": "success",
  "data": [
    {
      ...
      "endpoint": "http://localhost:4445/metrics",
      "state": "up",
      "labels": {
        "instance": "localhost:4445",
        "job": "laptop_exporter"
      ...
  ]
}
Grafana Agent also has Health & ready status API. This might be handy when you’re debugging Agent’s health and scrape issues. You can check them by running :
curl -s http://localhost:12345/-/ready

#sample output
Agent is Ready.

curl -s http://localhost:12345/-/healthy

#sample output
Agent is Healthy.
Scrape metrics using self hosted Prometheus (optional)
If you want to use your own Prometheus instead of Grafana Agent, then you can add a scrape job to your existing Prometheus config prometheus.yml like below :
global:
  scrape_interval: 30s
scrape_configs:
  - job_name: 'laptop_exporter'
    static_configs:
    - targets: ["localhost:4445"]
Import Grafana Dashboard
Once everything is setup, you can Import the Dashboard-ID : 11587 in your Grafana to visualize the metrics collected.
I’ve updated a few panels from the imported dashboard. For example for CPU temperature, my PromQL query is :
avg_over_time(ohm_cpu_celsius{instance="$instance"}[5m])
Here’s how my Grafana Dashboard looks after the edit :
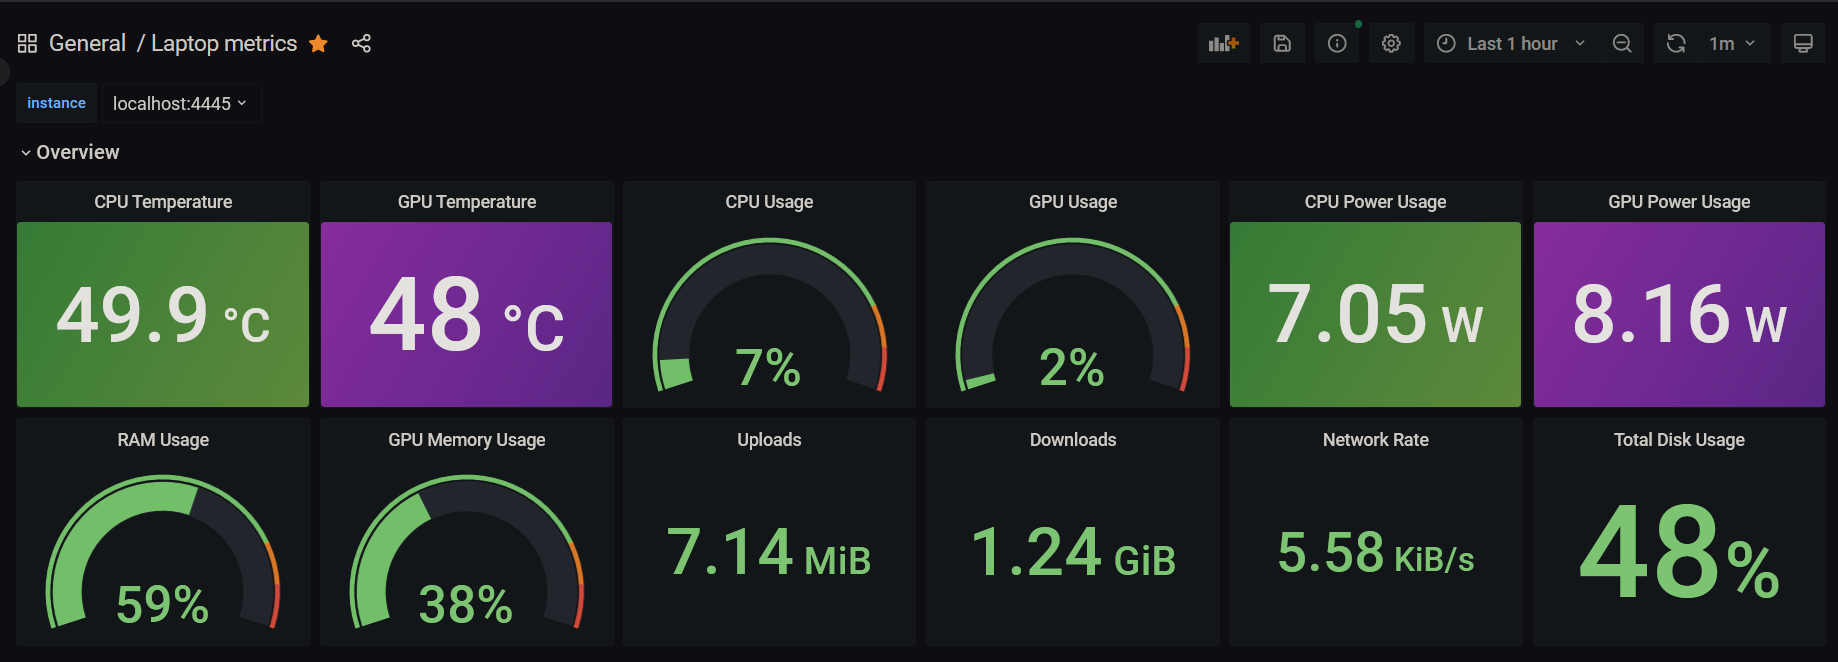
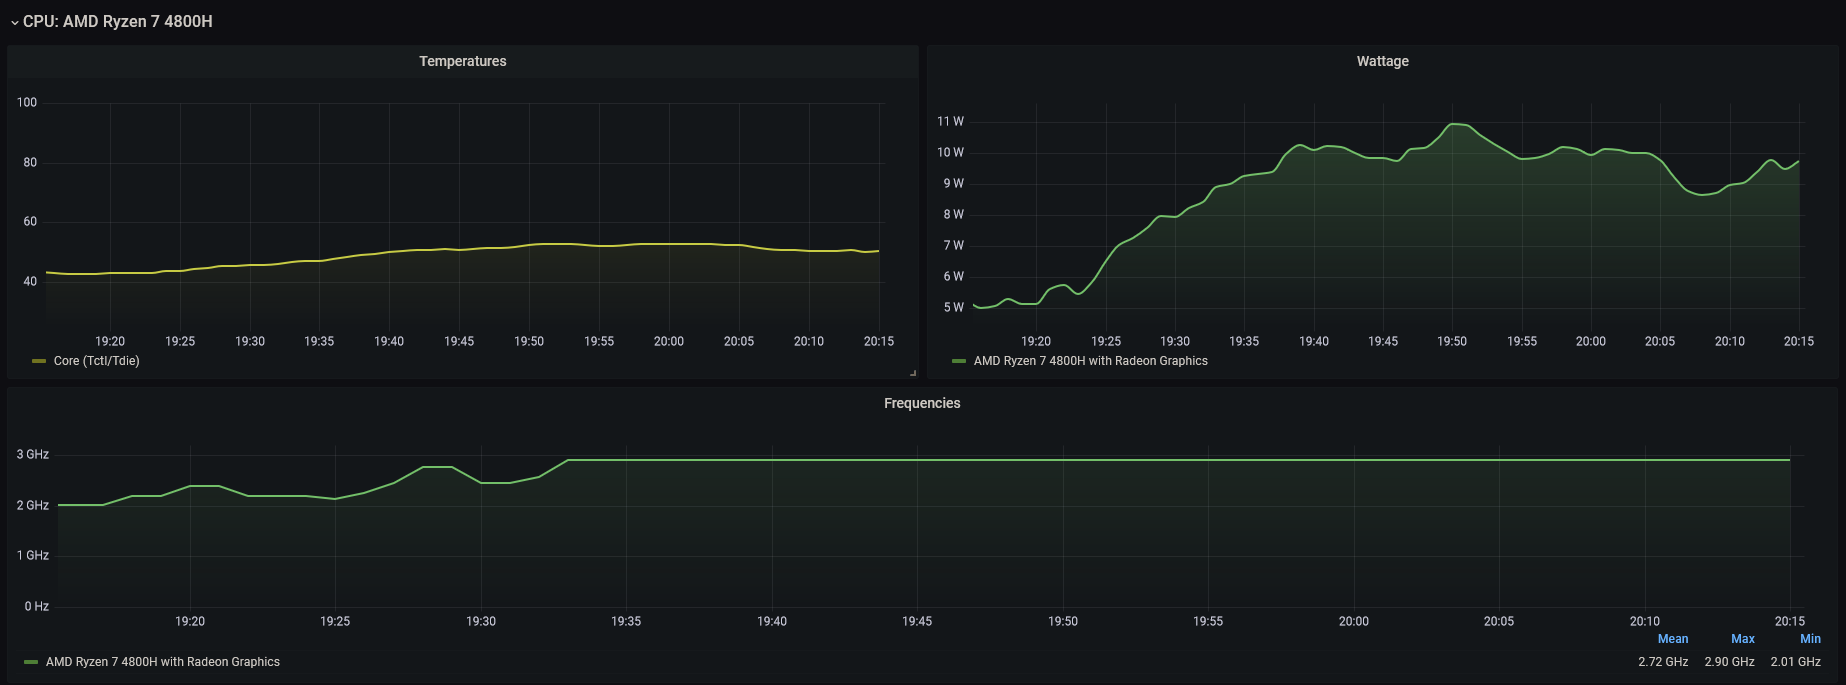
CPU Metrics:
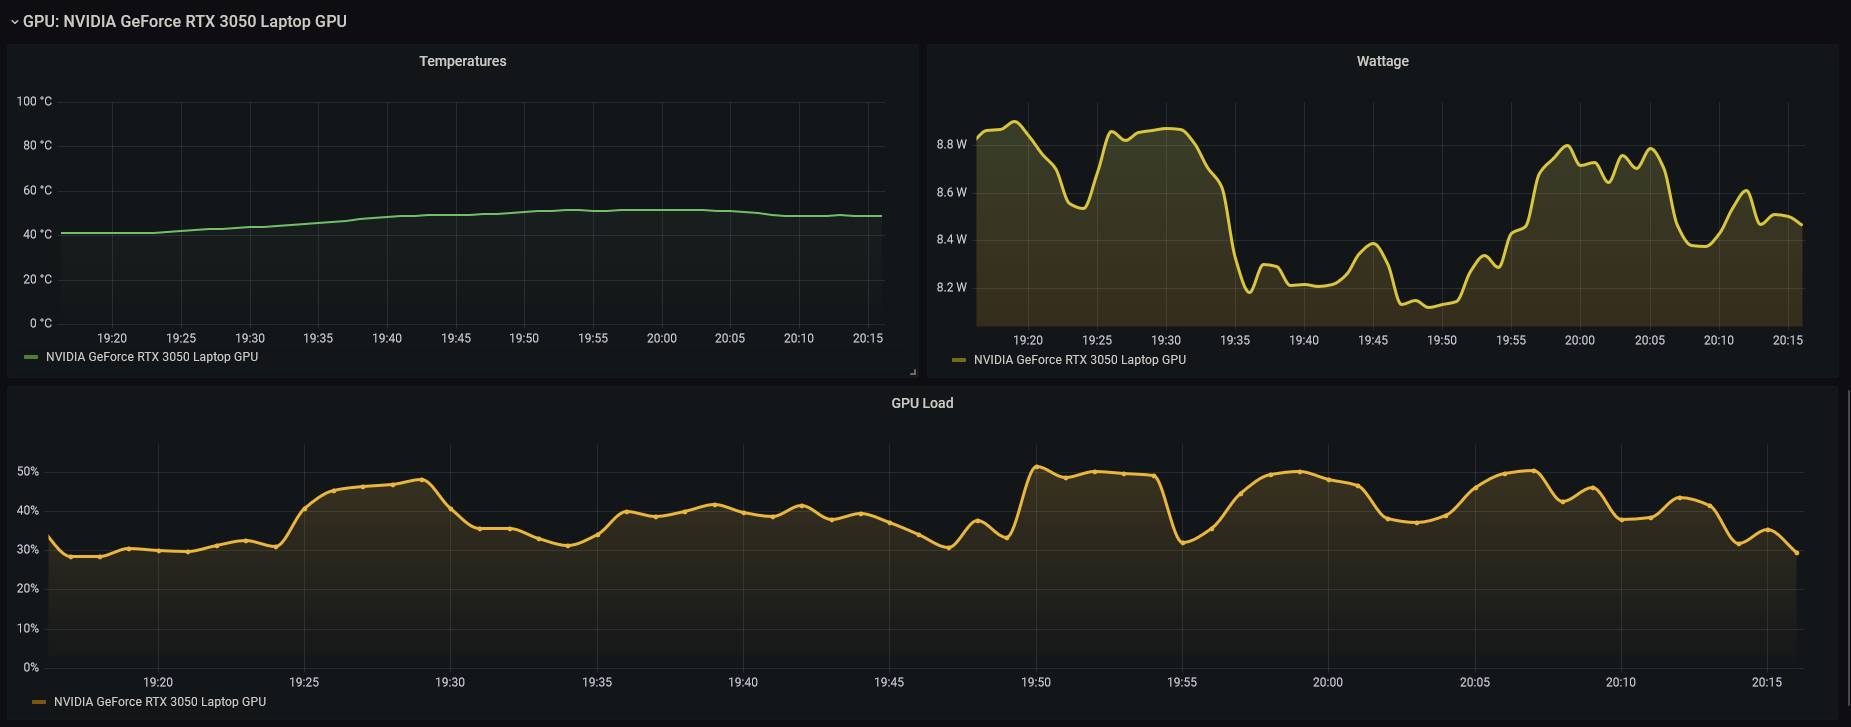
GPU Metrics:
Alerting
I don’t want to have an overlay of CPU and GPU temperatures on my screen while I’m gaming. Hence, I thought, Instead of having an overlay, why not create alerts for high temperatures and integrate those alerts to Grafana OnCall such that when my laptop is hot, I’ll get a call because who checks messages while gaming :D.
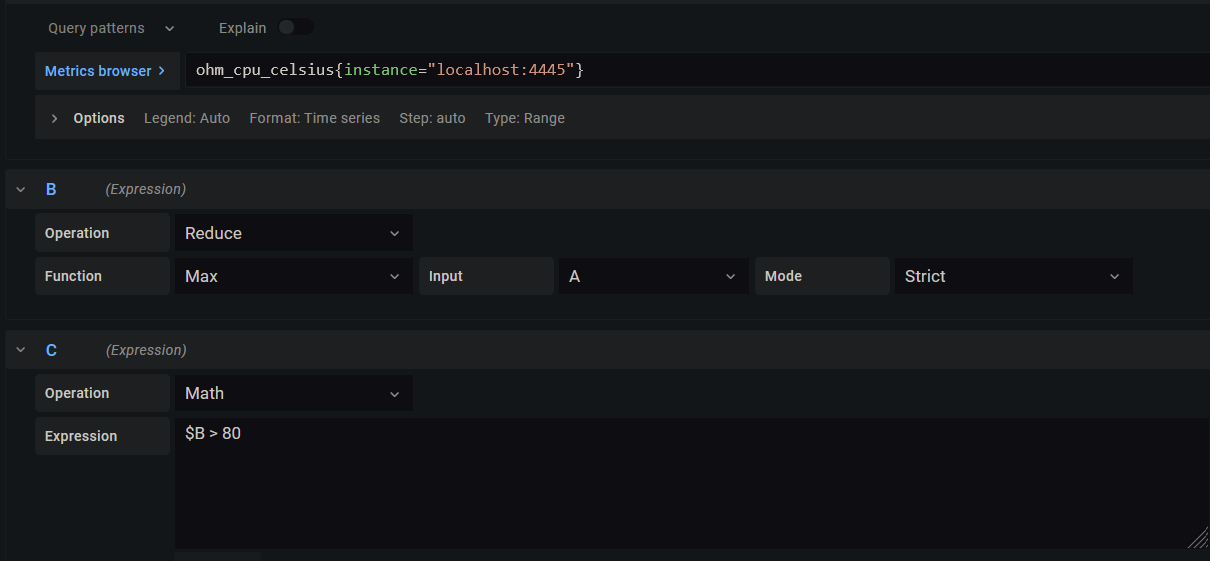
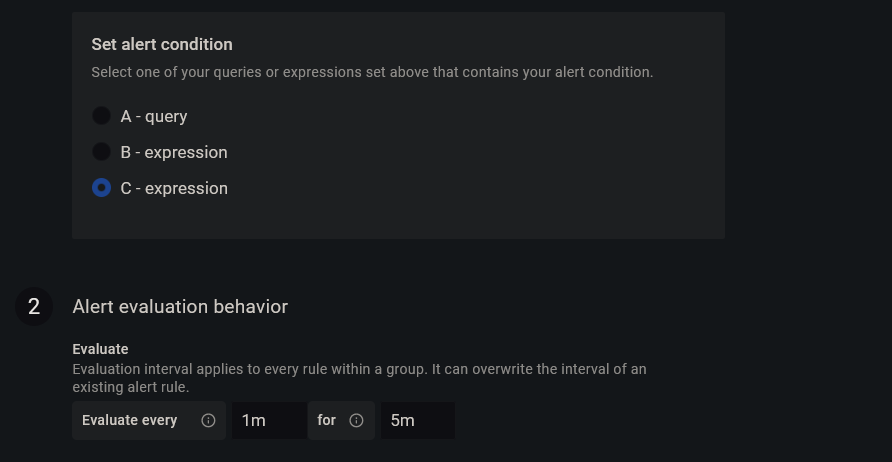
Alert for High CPU Temperature
I’ve configured the alert threshold to 80 degree. So, if my laptop CPU temperature stays above 80 degree for 5 minutes straight, I’ll get a phone call. Here’s how my alert config looks like.
Once I receive the call, I can choose to lower the game resolution and continue to play which should give a bit of breathing room for my laptop or close it so that laptop can cool itself.
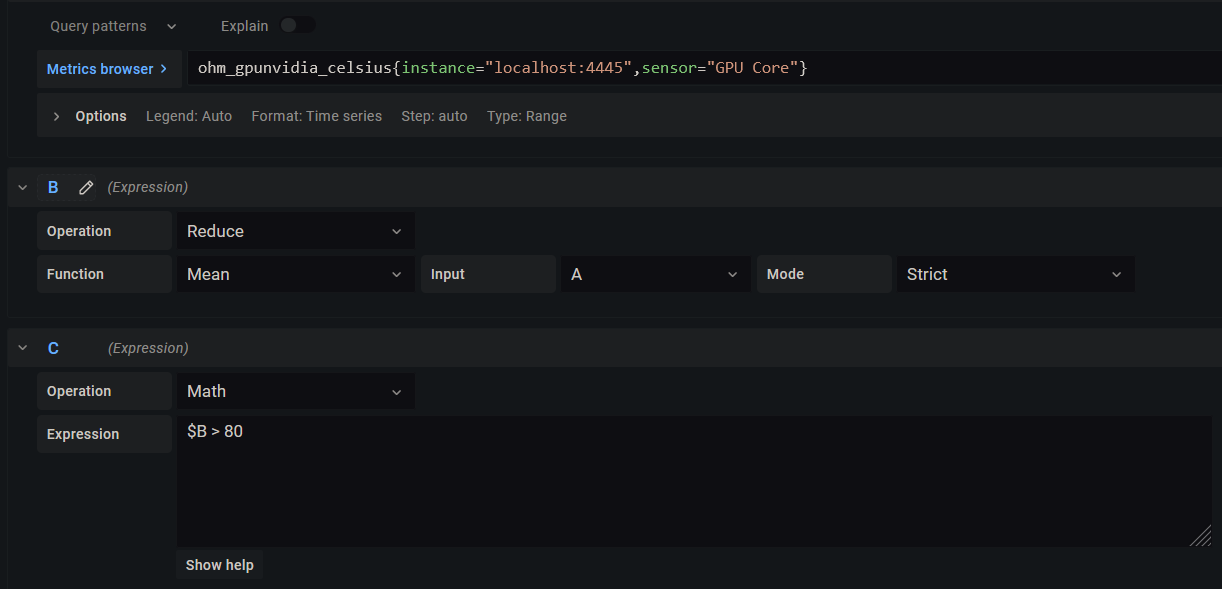
Alert for High GPU Temperature
Same config goes for GPU temperature alert as well. I’m averaging out the temperature value since I don’t want to be paged for a temperature spike. I’d like the alert to be fired only when the temperature is consistently higher than the threshold.
Alerting via AlertManager
There’s no specific requirement to use Grafana’s new alerting. If you’d like to use your own AlertManager, you can easily write an alert config by referring to an example from Awesome Prometheus alerts.
For notification configuration, use the <webhook_config> section and use the webhook from Grafana OnCall’s integration. Here’s the doc for webhook config options for AlertManager.
Grafana OnCall
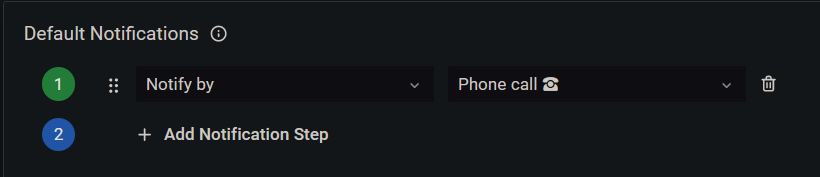
Configuring Grafana OnCall is fairly simple for Phone call alerts.
- Create or verify the user which phone number on the Users section. Set the Default notification Method to : Phone
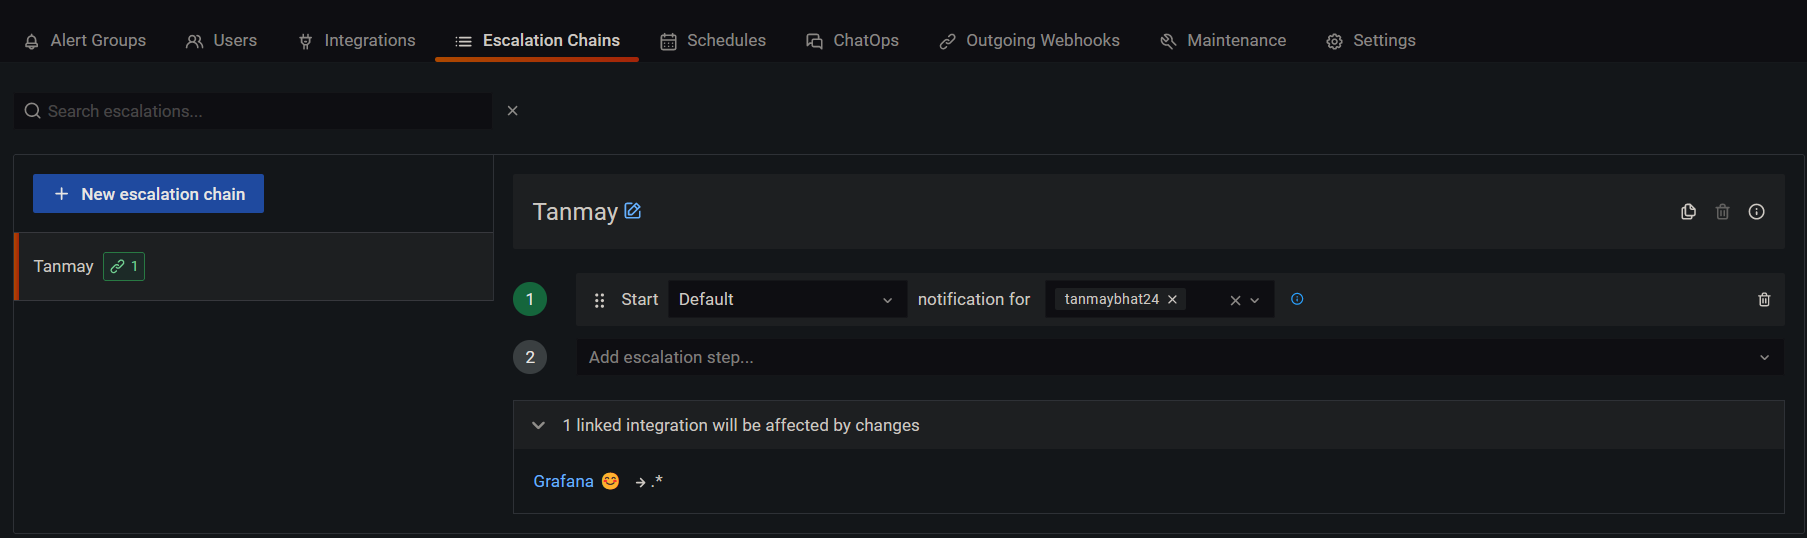
- Create a default escalation policy like below :
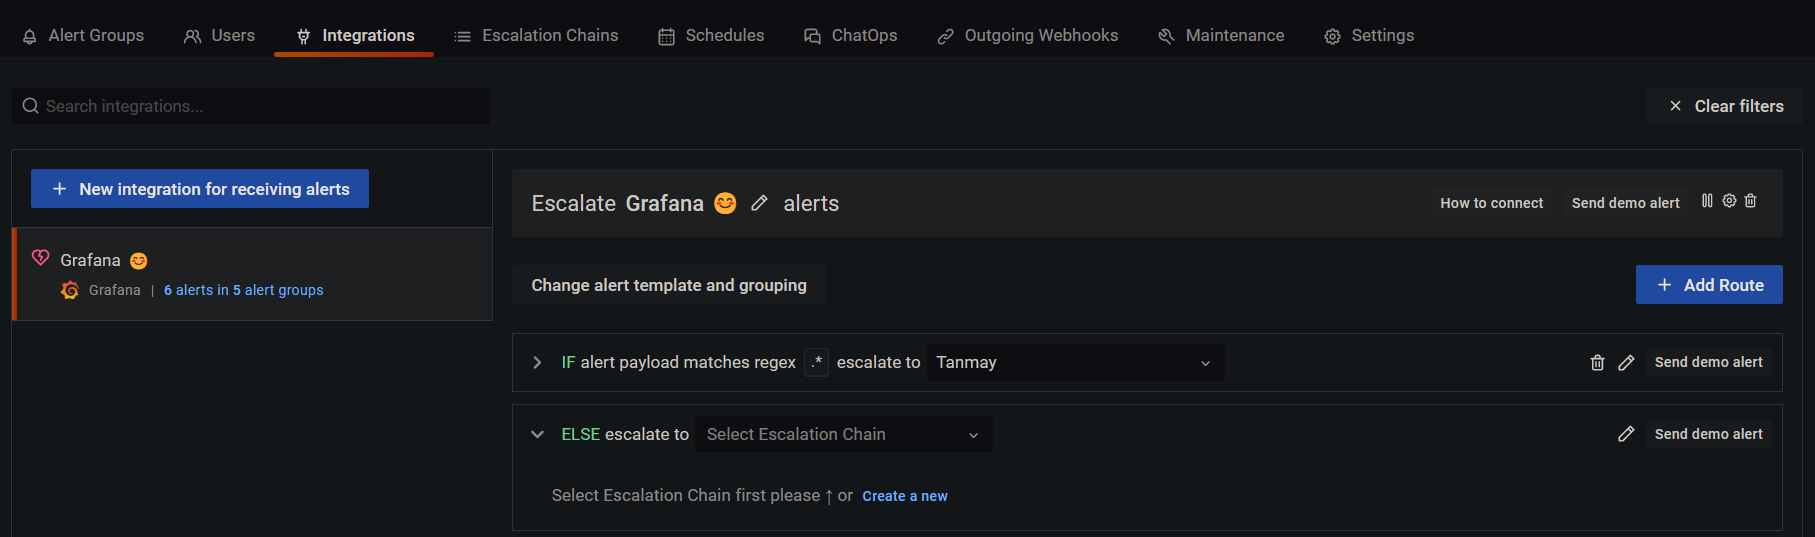
- Integrate the escalation policy you created to the Grafana Integration :
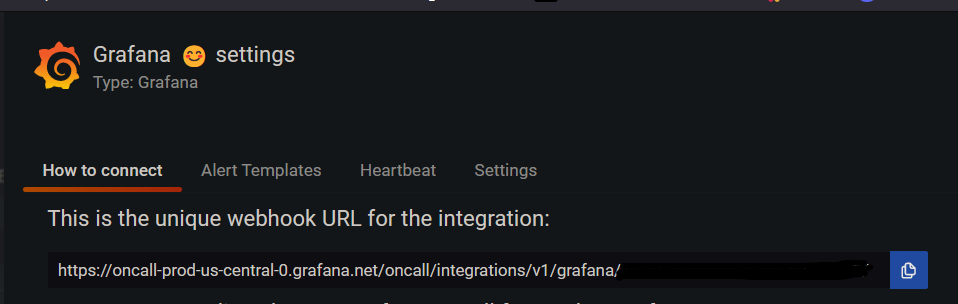
- Click on the “How to connect” as shown in the above screenshot which will give you the Grafana Oncall Webhook. Copy that.
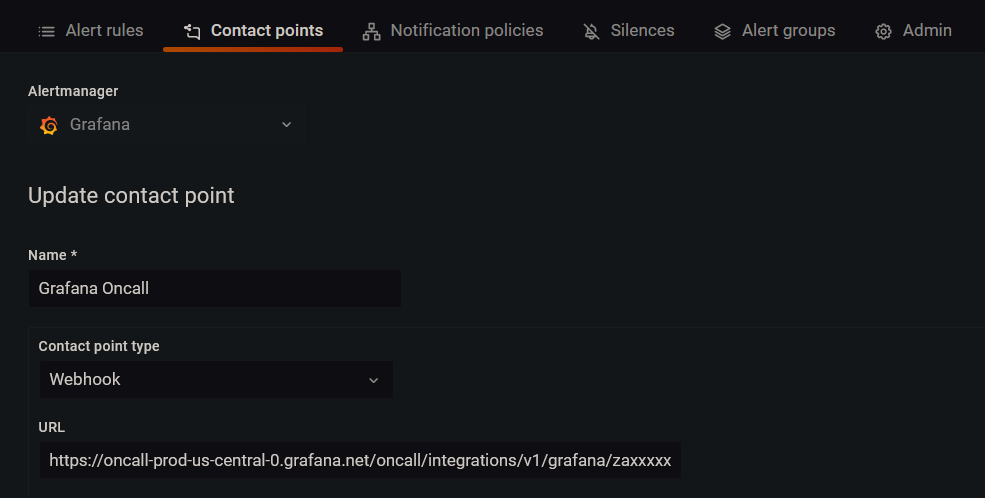
- Go to Alerting → Contact Points → New → Select type as : Webhook and past the URL you copied from above step.
That’s it, whenever the alert’s threshold reaches its value, you should get a phone call.
References
https://github.com/nickbabcock/OhmGraphite
https://prometheus.io/docs/alerting/latest/configuration