Who will monitor the monitoring system ? Itself………sounds a bit magical.
Since Prometheus monitors everything, it’s essential that we keep an eye on Prometheus so that over observability pillar stays strong.
If Prometheus goes down, you won’t be having any metrics, hence no alert for any services, scary stuff along with a call from your boss !!
Configuring Prometheus to monitor itself
Prometheus exposes metrics about itself at /metrics endpoint, hence it can scrape and monitor its own health.
- Add a Prometheus scrape job in
prometheus.ymlconfig file :
scrape_configs:
      - job_name: prometheus
        static_configs:
          - targets:
            - localhost:9090 # prometheus endpoint address
- Restart the Prometheus & curl the
/metricsendpoint of Prometheus server to verify:
curl http://localhost:1256/metrics

# HELP go_gc_duration_seconds A summary of the pause duration of garbage collection cycles.
# TYPE go_gc_duration_seconds summary
go_gc_duration_seconds{quantile="0"} 7.3633e-05
go_gc_duration_seconds{quantile="0.25"} 9.2295e-05
go_gc_duration_seconds{quantile="0.5"} 0.000100231
go_gc_duration_seconds{quantile="0.75"} 0.000110334
go_gc_duration_seconds{quantile="1"} 0.001204485
go_gc_duration_seconds_sum 43.914716791000004
go_gc_duration_seconds_count 191769
Looks good, let’s move ahead.
Time Series
Prometheus fundamentally stores all data as time series streams of timestamped values belonging to the same metric and the same set of labeled dimensions.
Understanding valuable metrics
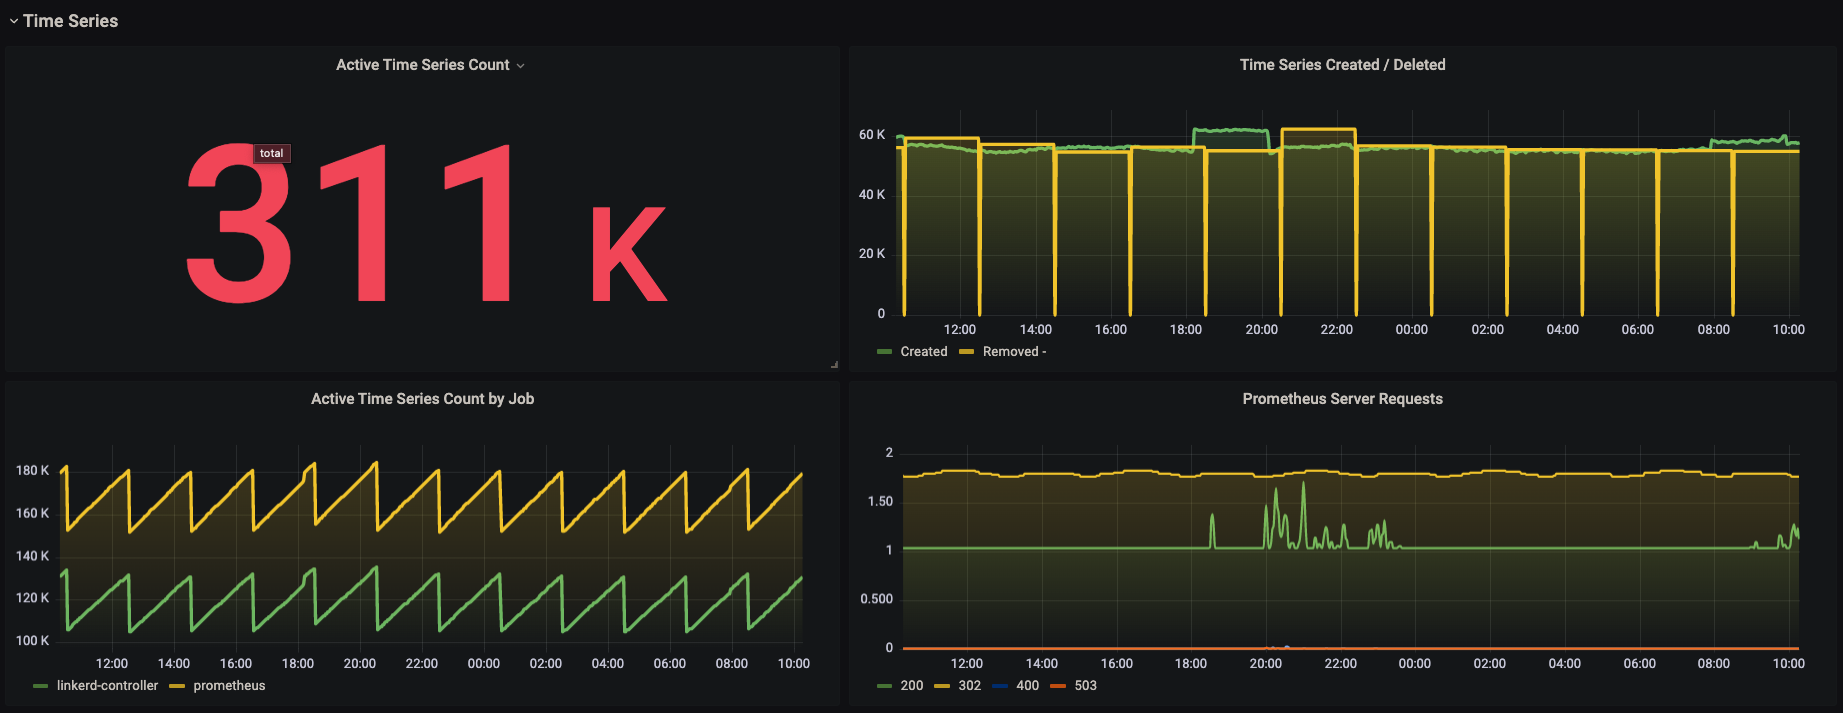
1. Active time Series count : prometheus_tsdb_head_series
metric type : Gauge
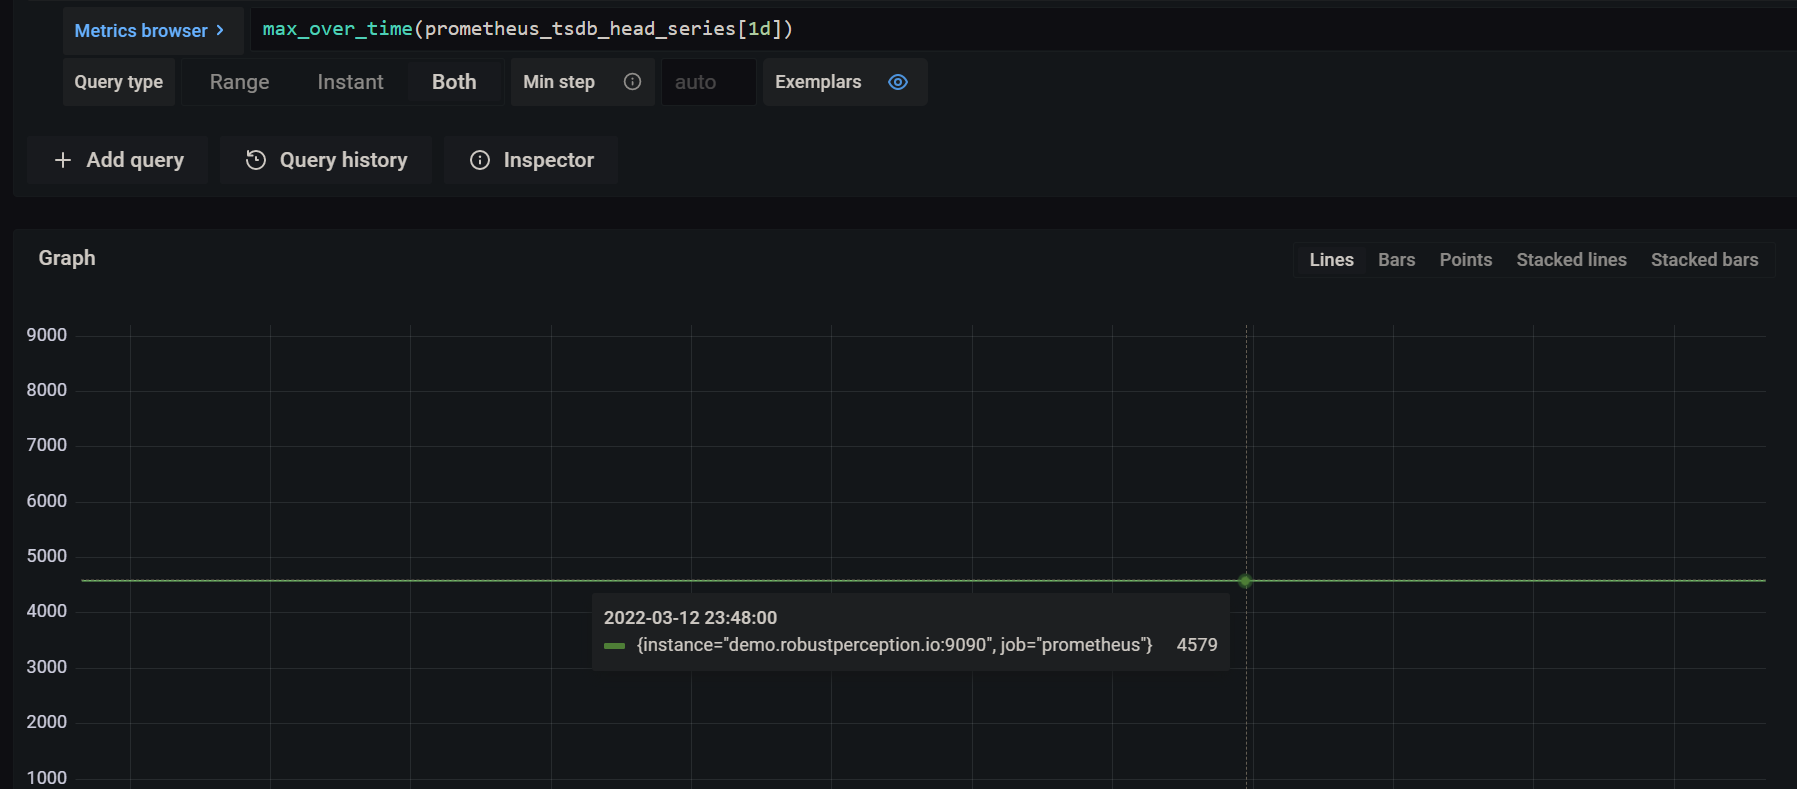
- This metric shows total number of active time series in the head block.
- A time series is considered active if new data points have been generated within the last 15 to 30 minutes.
- A head block in TSDB is an in-memory part of database where time series are stored for a shorter period and then later flushed to persistent disk storage.
- Read more about how head block works in Prometheus TSDB here.
- Total Available series in head block can be calculated using the below expression :
max_over_time(prometheus_tsdb_head_series[1d])
2. Time Series Created : prometheus_tsdb_head_series_created_total
metric type: Counter
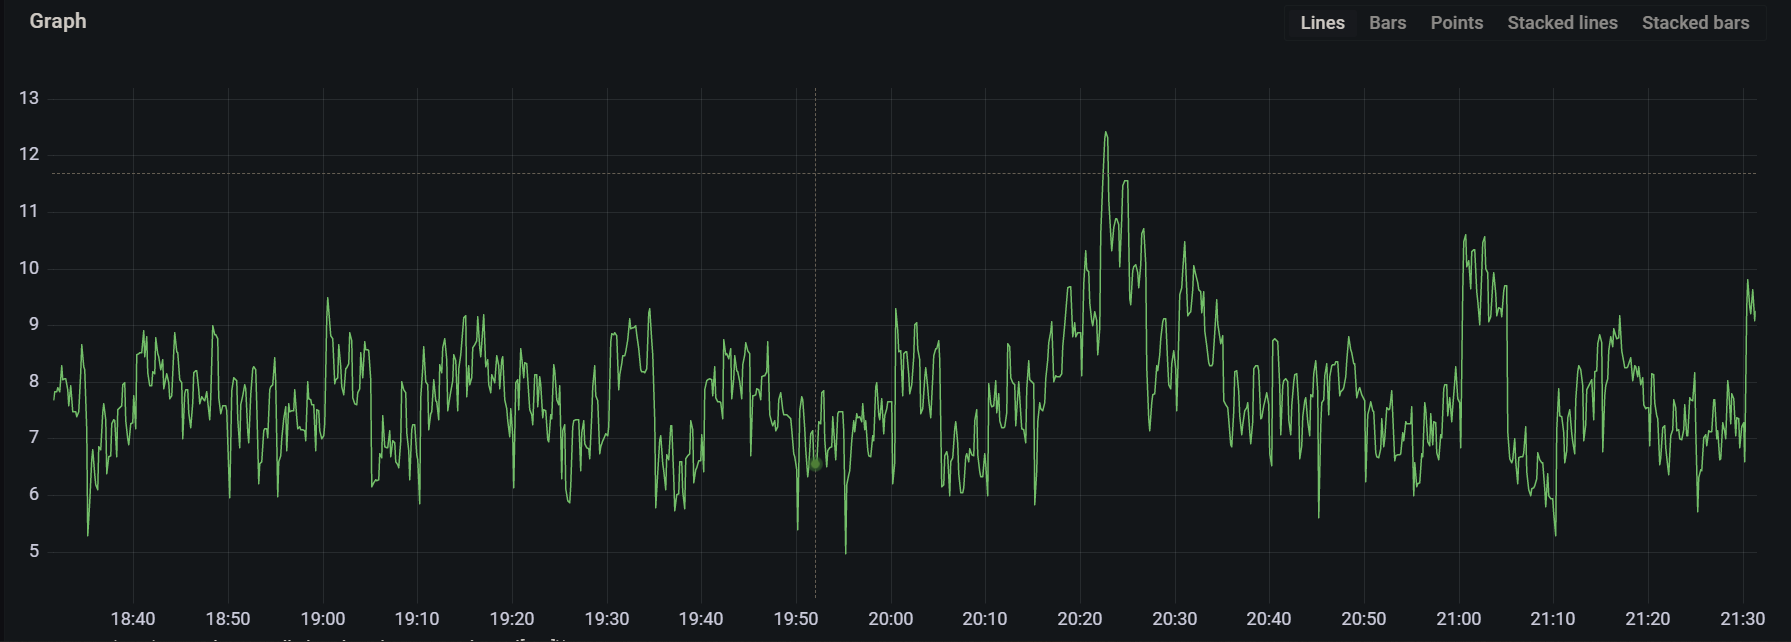
- This metrics displays total number of time series created in the head block.
- Since it’s a counter, we can calculate its rate with expression :
rate(prometheus_tsdb_head_series_created_total[5m])
3. Time Series Deleted : prometheus_tsdb_head_series_removed_total
metric type: Counter
- This metrics displays total number of time series removed in the head block.
- To calculate, rate of deletion of time series with per second average, you can run :
rate(prometheus_tsdb_head_series_removed_total[5m])
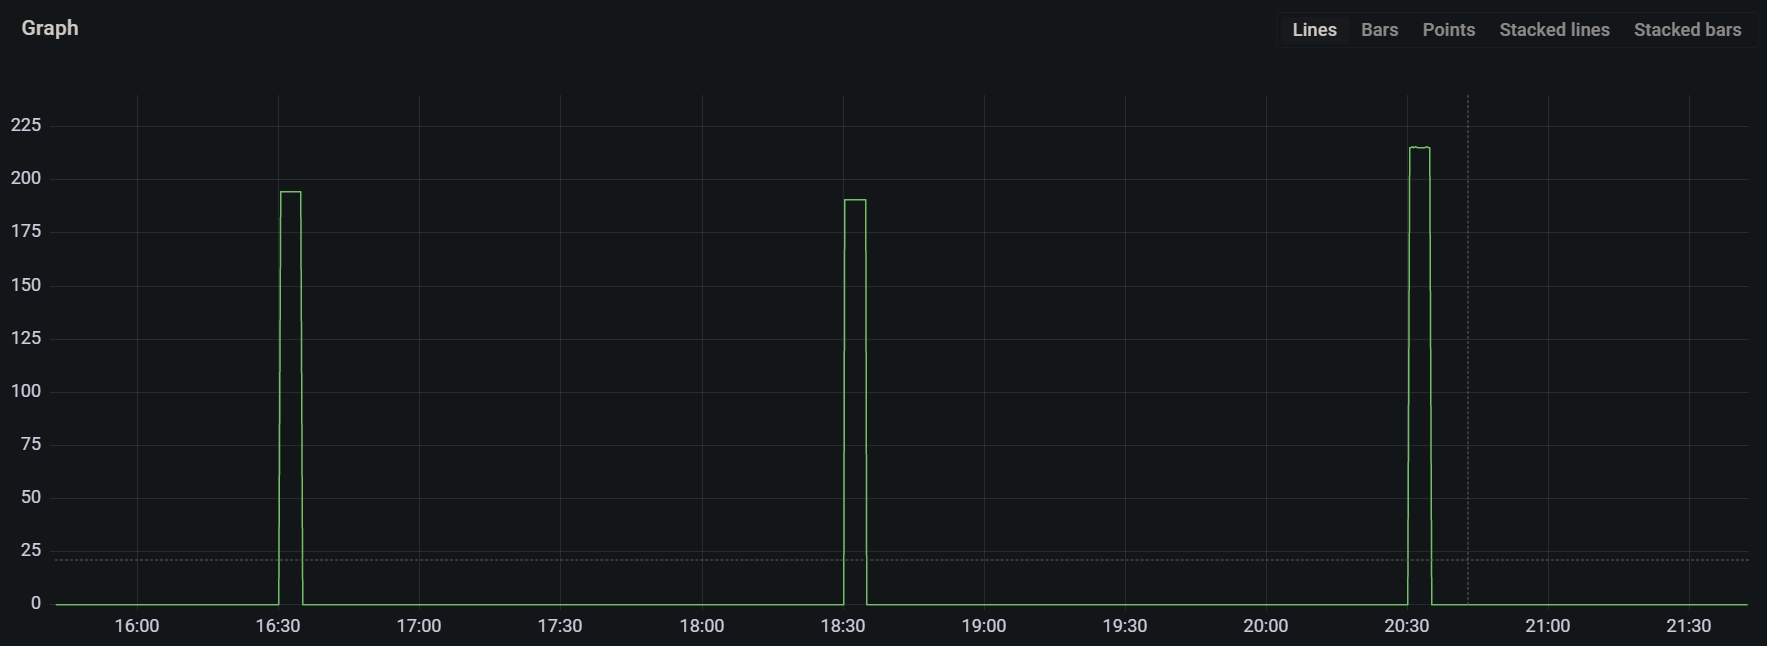
- As you can see from the above graph, the time series are removed from the head and are flushed to persistent storage around every 2 hours.
Samples:
- A sample is a combination of
timestamp, valueof a time series metric. - For example, memory used by container A at time 1:50 & 1:51. These are two samples for the same metric or same time series.
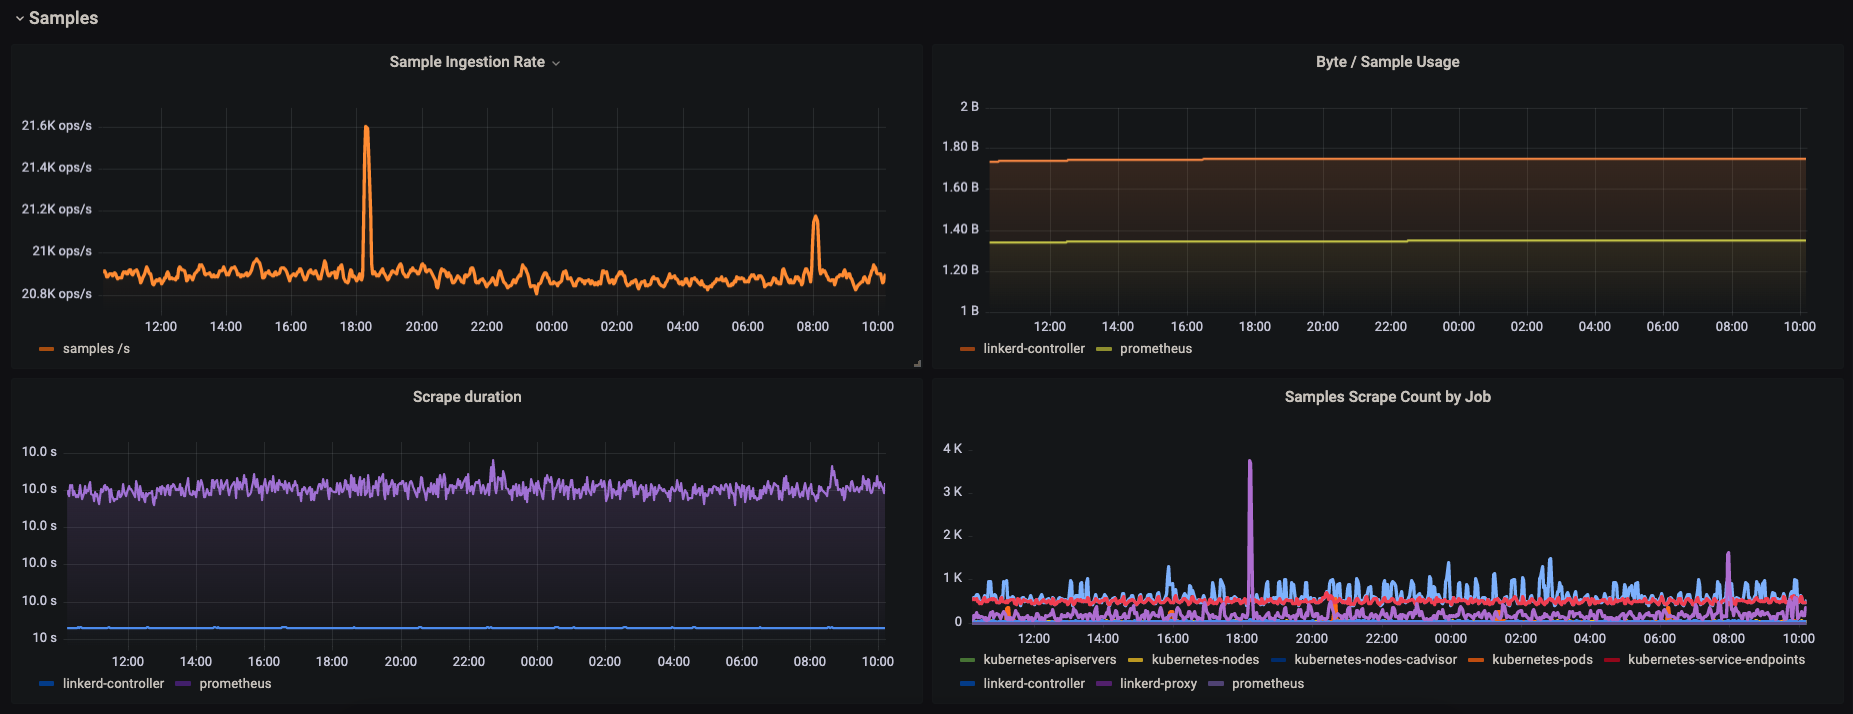
4. Samples ingested : prometheus_tsdb_head_samples_appended_total
metric type: Counter
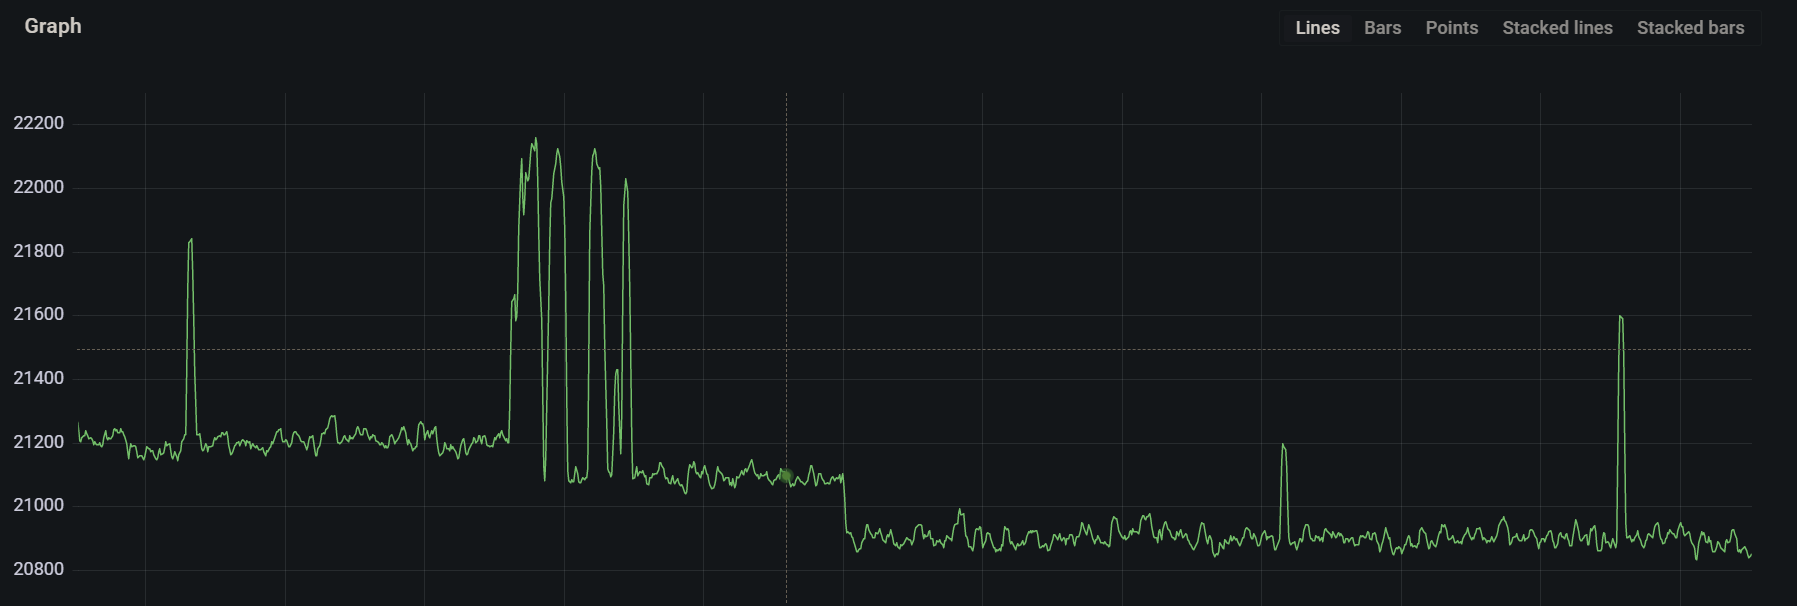
- This metric shows total number of appended samples into the head block.
- This metrics is different from the metric
scrape_samples_scrapedbecause the appended metric shows the number of samples added / ingested into head block, whereas samples_scraped shows how many samples were scraped. The difference comes into play when you are dropping a lot of metrics via relabel config in your Prometheus config. - Sample ingestion rate can be calculated with the expression :
rate(prometheus_tsdb_head_samples_appended_total[5m])
5. Sample size :
metric type: Gauge
- The below expression will give the size of the sample ingested by the Prometheus.
- In an ideal scenario, the size of each sample will be around 1-2 byte.
- Sample size monitoring is essential because if there’s anomaly and size goes beyond 3-4 byte, Storage of the server will wear out quickly, leading to disaster.
- Size of sample can be calculated using the below :
(rate(prometheus_tsdb_compaction_chunk_size_bytes_sum[1d])) / rate(prometheus_tsdb_compaction_chunk_samples_sum[1d])

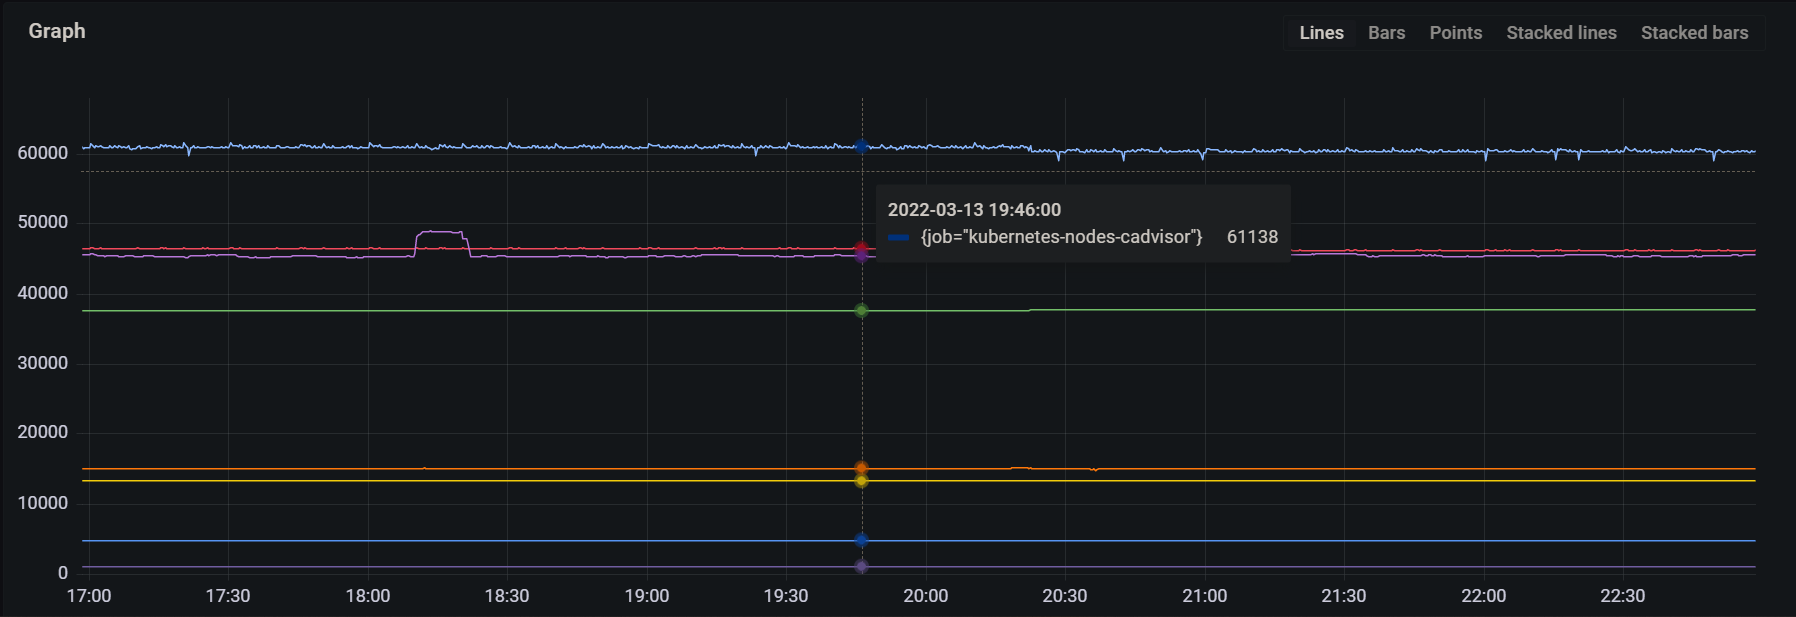
3. Samples scraped per job : scrape_samples_scraped
metric type: Counter
- Over time, you might need to keep an eye on which job is contributing to the highest samples getting scraped and ingested. For that, the above metric comes to the rescue.
- In an easier way, this metric displays how many metrics are scraped by a job. Hence, you can write a promQL expression to configure an alert too if it breaches a certain threshold.
- Total samples scraped / job can be calculated by using the below expression :
sum by (job)(scrape_samples_scraped)
3. Scrape duration : prometheus_target_interval_length_seconds
metric type: Gauge
- You might also need to monitor the scrape duration heath of your Prometheus.
- If the duration goes beyond a certain threshold value, the samples will get out of order.
- More details & debugging out of order samples here.
P99 of the scrape duration can be calculated using the below expression :
prometheus_target_interval_length_seconds{quantile="0.9"}

I’ve listed above some important metrics you can look for, there’s lot more of them at /metrics endpoint of your Prometheus server.
Grafana Dashboard
For quicker insights, I’ve made a Grafana dashboard from all the above expressions mentioned.
Which looks like this :
You can import the JSON file from here to your Grafana instance to get started.
References :
https://www.omerlh.info/2019/03/04/keeping-prometheus-in-shape/
https://ganeshvernekar.com/blog/prometheus-tsdb-the-head-block/